This essay provides a broad overview of the sub-field of machine learning interpretability. While not exhaustive, my goal is to review conceptual frameworks, existing research, and future directions.
I follow the categorizations used in Lipton et al.'s Mythos of Model Interpretability, which I think is the best paper for understanding the different definitions of interpretability. We'll go over many ways to formalize what "interpretability" means. Broadly, interpretability focuses on the how. It's focused on getting some notion of an explanation for the decisions made by our models. Below, each section is operationalized by a concrete question we can ask of our machine learning model using a specific definition of interpretability. If you're new to all this, we'll first briefly explain why we might care about interpretability at all.
Why Care About Interpretability?
First, interpretability in machine learning is useful because it can aid in trust. As humans, we may be reluctant to rely on machine learning models for certain critical tasks, e.g., medical diagnosis, unless we know "how they work." There's often a fear of the unknown when trusting in something opaque, which we see when people confront new technology, and this can slow down adoption. Approaches to interpretability that focus on transparency could help mitigate some of these fears.
Second, safety. There is almost always some shift in distributions between model training and deployment. Failures to generalize or phenomena like Goodhart's Law, such as specification gaming, are open problems that could lead to issues in the near future. Approaches to interpretability, which explain the model's representations or which features are most relevant, could help diagnose these issues earlier and provide more opportunities to remedy the situation.
Third, and perhaps most interestingly, contestability. As we delegate more decision-making to ML models, it becomes important for the people to appeal these decisions. Black-box models provide no such recourse because they don't decompose the decision into anything contestable. This lack of contestability has already led to significant criticism of proprietary recidivism predictors like COMPAS. Approaches to interpretability, which focus on decomposing the model into sub-models or illustrate a chain of reasoning, could help with such appeals.
Defining Interpretability
Lipton et al. break interpretability down into two types: transparency and post-hoc.
Transparency Interpretability
According to Lipton et al., transparency as interpretability refers to the model's properties that are useful to understand and can be known before the training begins; they propose three distinct (but related) questions.
Simulatibility: Can a human walk through the model's steps?
This property addresses whether or not a human could go through each step of the algorithm and check if each step is reasonable to them. Linear models and decision trees are often cited as interpretable models using such justifications; the computation they require is simple, and it is relatively easy to interpret each of the steps executed when a prediction is made. Linear models also have the nice property that the parameters themselves have a very direct mapping–they represent how important different input features are. For example, I trained a linear classifier on MNIST. Here are some of the weights, each of which corresponds to a pixel value:
0.00000000e+00, 0.00000000e+00, 0.00000000e+00, -1.47542413e-03,
-1.67811041e-04, -3.83280468e-02, -8.10846867e-02, -5.01943218e-02,
-2.90314621e-02, -2.65494116e-02, -8.29385683e-03, 0.00000000e+00,
0.00000000e+00, 1.67390785e-04, 3.92789141e-04, 0.00000000e+00,
0.00000000e+00, 0.00000000e+00, 0.00000000e+00, 0.00000000e+00]
By themselves, these weights are hard to interpret. Even if we knew which pixels they corresponded to, it's difficult to pin down what a particular pixel even represents, especially for large images. However, there is an easy trick to turn these weights into something interpretable. We reshape them into the same dimension as our model inputs and view it as an image, with the pixel color represented by the weight value.
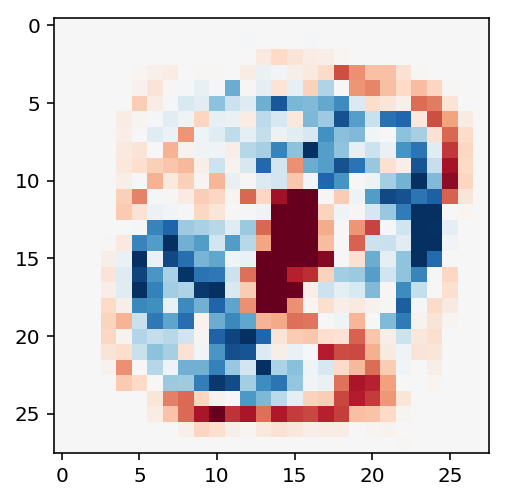
Here are the weights for the model that looks for the digit 0:
And here are the weights for the model that looks for the digit 3:
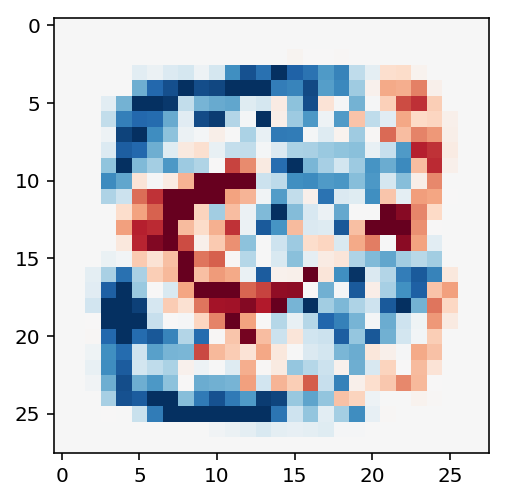
In both cases, we can see that the blue regions, representing positive weight, correspond to a pixel configuration that looks roughly like the digit being detected. In the case of 0, we can see a distinct blank spot in the center of the image and a curve-like shape around it; the curves of the 3 are also apparent.
However, Lipton et al. point out that this desideratum can be less about the specific type of model and more about the its size. A decision tree with a billion nodes, for example, may still be challenging to understand. Understanding is also about holding most of the model in your mind, which is often about how the model is parameterized [1].
Of course, parameterization is not the whole story. There are methods like K-Nearest Neighbors, which are parameterized by your entire dataset; this could be billions of points. Yet, there is a sense in which KNN is still interpretable despite its massive size. We can clearly describe what the algorithm does, and we can even see "why" it made a particular choice because the algorithm is simple to understand.
Decomposability: Is the model interpretable at every step or with regards to its sub-components?
Another desirable feature is to understand what the model is doing at each step. For example, imagine a decision tree whose nodes correspond to easily identifiable factors like age or height. The model's prediction can be interpreted in terms of what decisions are taken at different nodes of the tree. In general, such a detailed analysis (of decisions taken by the model per-timestep) is difficult because the model's performance is very tightly coupled with the representations used. Raw features, e.g., RGB pixel values, are often not very interpretable by themselves but could be very informative for the learning model. On the other hand, interpretable features may not be the most informative for the model.
For example, I trained a decision tree for MNIST using the following interpretable features:
- The average brightness of the image - average_luminosity
- The average brightness of the image's outline (found using an edge detector) - edge_property
- The number of corners found in the image's outline - num_corners
- The width of the image - max_width
- The height of the image - max_height
It seems like there would be at least some useful information in these features; "ones" tend to have less area (so average_luminosity would be lower), "eights" might have more corners, etc. Yet, the resulting decision tree of depth 3 (shown below) achieves only 33% training accuracy. Going all the way to the depth of ten only bumps it to around 50%.

If we look at the nodes, we can perhaps understand what's going on. At the top, we can see that our model will predict a "one" if the width is less than 7.5 pixels, which seems intuitive as "one" is likely going to be the thinnest digit. Near the bottom, we see that the number of corners is being used to differentiate between "deven" and "four." This also seems reasonable as "four" s do have more visual corners than "seven" s. But these are very crude features, and hence the overall performance is still not very good.
I compare these hand-designed features with the raw visual features by training a decision tree (of depth 3) using the pixel values, i.e., a vector of 784 grayscale values. The resulting model, shown below, gets 50% train and test accuracy.

Here, it's not clear why these pixel values were chosen to be the splitting points. And yet the resulting decision tree, for the same number of nodes, performs much better. In this simple case, the performance vs. interpretability trade-off in representation is quite significant.
Algorithmic Transparency: Does the algorithm confer any guarantees?
This question asks if our learning algorithm has any desirable properties which are easy to understand. For example, we might know that the algorithm only outputs sparse models, or perhaps it always converges to a specific type of solution. In these cases, the resulting learned model can be more amenable to analysis. For example, the Hard Margin SVM is guaranteed to find a unique solution that maximizes the margin. Similarly, the perceptron is guaranteed to find parameters (not necessarily unique ones, though) that achieve a training loss of 0 if the data are linearly separable.
When it comes to deep learning, a full overview of results would be beyond the scope of this essay. In general, though, there will be many other configurations of values that will also perform comparably. This means we don't have a direct analogy to the notion of some unique set of weights that perform well on the task at hand.
The KNN algorithm discussed earlier illustrates another level of understanding regarding "what the algorithm does in simple terms" beyond mechanical transparency. KNN is easy to describe as "it reports the labels of the points closest to the input". The part of this property that's doing the most work here is how we describe. Obviously, most ML models can be described as "it finds parameters which satisfy certain constraints", but this is a very broad and unactionable statement. It seems harder to find a description at the same level of granularity for neural nets beyond something like "it learns a high-dimensional manifold that maps onto the input data". Even though we can often get succinct summaries of what an ML model is doing, only some of them are informative from a simulatable perspective.
Post-Hoc Interpretability
Lipton et al. pose four questions on post-hoc interpretability, which refers to things we can learn from the model after training has finished.
Text Explanation: Can the model explain its decision in natural language, after the fact?
Like how humans can provide post-hoc justifications for their actions, it could be informative to have models that can also explain, probably as natural language statements. Naive methods of pairing text with decisions, however, will likely optimize for something like "how credible the explanation sounds to a human" rather than "how accurate the explanation is at summarizing the steps taken by the model.".
While this seems clearly desirable, it's still an emerging field, and Lipton et al. only offer one paper, which focuses on RL. On ConnectedPapers, I found that the referenced paper is part of a larger related field of reinforcement learning with human advice. This seems to focus on the converse problem: given human explanations, how can models incorporate them into their decision-making? Maybe insights here can eventually be used in the other direction.
Visualization/Local Explanations: Can the model identify what is/was important to its decision-making?
This question focuses on how the inputs and outputs change relate to one another.
Saliency maps are a broad class of approaches that look at how a change in the input (or parts of the input) changes the output. A straightforward way to do this is to take the derivative of the loss function with respect to the input. Beyond this simplistic approach, many modifications involve averaging the gradient, perturbing the input, or local approximations. Understanding Deep Networks via Extremal Perturbations and Smooth Masks has a good overview of the work in this area.
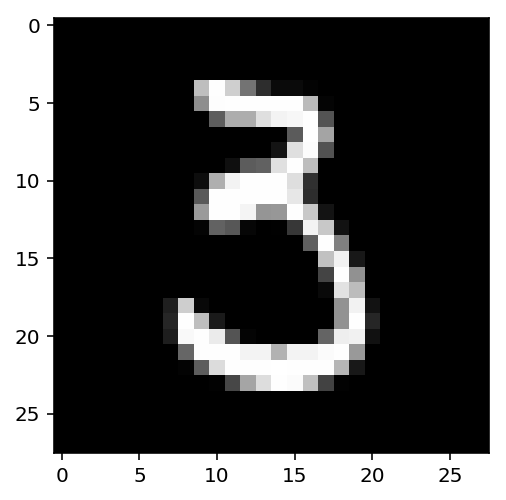
As an example, I trained a CNN on MNIST and did a simple gradient visualization on an image of this 3:
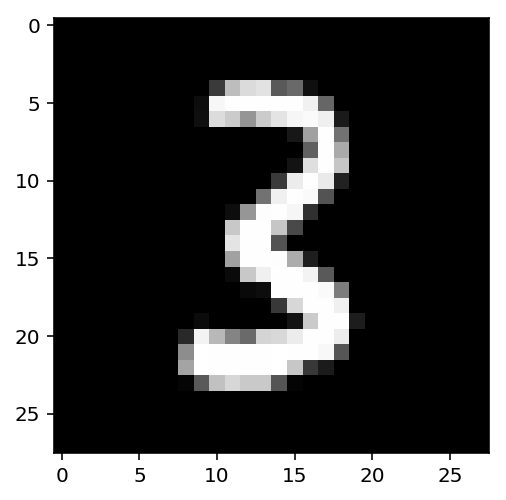
Using PyTorch, I computes the derivative of the logit (that corresponds to the digit “three”) with respect to the input image. This gave me the image below. Here, the white pixels correspond to parts of the image that would increase the logit value for “three”, and the black pixels correspond to the reverse. We can see the rough curves of the digit “three” come through.
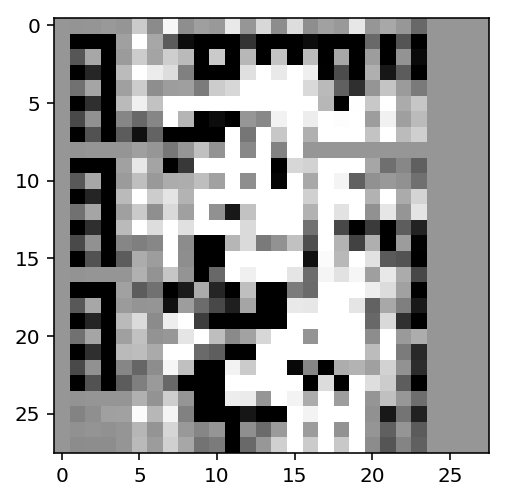
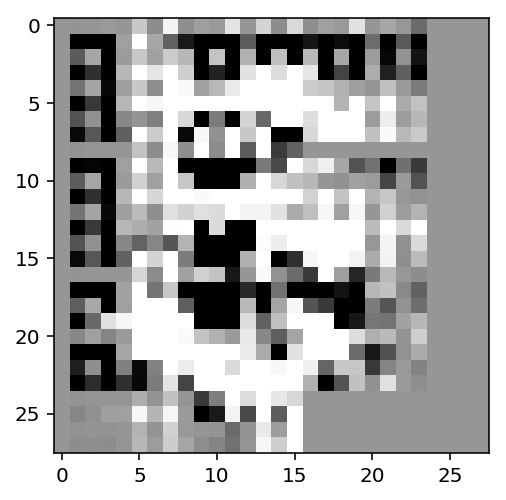
Note how this is different from the visualization we previously had with the linear classifier in red and blue in the first section. Those visualizations represented the importance in aggregate for the entire input space. The visualization here is meaningful only for this specific input. For a different input, e.g., a different instance of the digit “three,” the local gradient would look different, as shown below:
Another family of approaches focuses on visualizing with respect to the model parameters themselves, rather than the input. A lot of the work has been done by Chris Olah, Shan Carter, Ludwig Schubert, and others on distill.pub. Their work in this area has gone from visualizing the activations of specific neurons and layers to entire maps of activations for many networks, to decomposing models into interpretable building blocks. Another excellent visualization resource for this type of work is the OpenAI Microscope. Progress here has been very exciting, but it remains to be seen if similar approaches can be found for neural nets that focus on tasks other than image recognition.
Explanation by Example: Can the model show what else in the training data it thinks are related to this input/output?
This question asks for what other training examples are similar to the current input. When the similarity metric is just distance in the original feature space, this is akin to a KNN model with K = 1. More sophisticated methods may look for examples similar in the representation or latent space the model is using. The human justification for this type of approach is that it is similar to reasoning by analogy, where we present a related scenario to support our actions.
While I think this is useful, it definitely doesn't seem like all we need for understanding or even most of what we would need.
What Are Existing Overviews?
For a deeper dive into specific techniques, I recommend A Survey Of Methods For Explaining Black-Box Models, which covers a wide variety of approaches for many different specific machine learning models as well as model-agnostic algorithms. For neural nets, Explainable Deep Learning: A Field Guide for the Uninitiated provides an in-depth read. For other conceptual surveys of the field, Definitions, methods, and applications in interpretable machine learning and Explainable Machine Learning for Scientific Insights and Discoveries. The Explainable Machine Learning paper, in particular, is quite nice because it gives a hierarchy of increasingly more interpretable models across several domains and use cases.
What's Next?
Broadly, I think there are two main directions that interpretability research should go, outside of the obvious direction of "find better ways to formalize what we mean by interpretability." These two areas are evaluation and utility.
Evaluation
The first area is to find better ways of evaluating these numerous interpretability methods. For many of these visualization-based approaches, a default method seems to be sanity-checking with a human-in-the-loop, ensuring that interpretable features are being highlighted. Indeed, that's what we did for the MNIST examples above. However, we can't do this at scale; it would be infeasible to add human evaluation for every single model output.
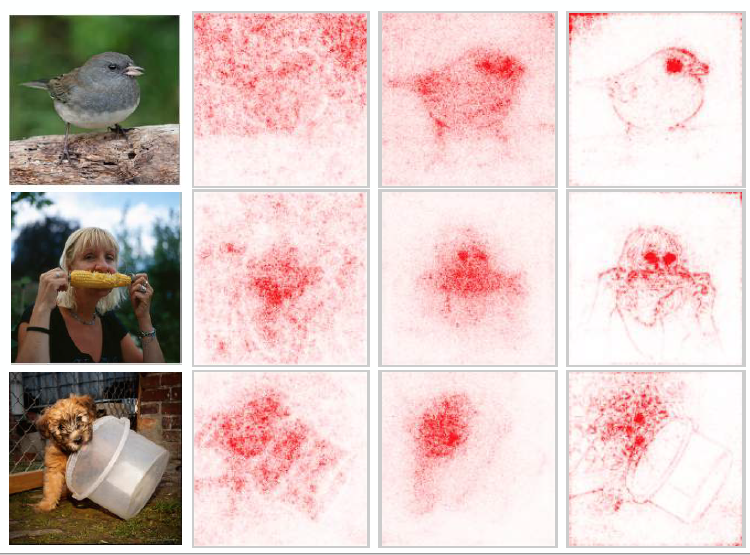
Moreover, Sanity Checks for Saliency Maps, a recent paper, makes a strong case for why this is not enough. As mentioned earlier, saliency maps represent a broad class of approaches that try to understand what parts of the input are essential for the model's output, often through the gradient. The outputs of several of these methods are shown below. Upon visual inspection, they might seem reasonable as they all seem to focus on the relevant parts of the image.

However, the very last column is the output, not for a saliency map, but for an edge detector applied to the input. This makes it not a function of the model but merely the input. Yet, it can output "saliency maps," which are visually comparable to these other results. This might cause us to wonder if the other approaches are really telling us something about the model. The authors propose several tests to investigate.
The first test compares the saliency map of a trained model with a model that has randomly initialized weights. Here, clearly, if the saliency maps look similar, it is more dependent on the input and not the model's parameters.
The second test compares the saliency map of a trained model with a trained model that was given randomly permuted labels. Once again, if the saliency maps look similar, this is also a sign of input dependence because the same "salient" features have been used to justify two different labels.
Overall, the authors find that the basic gradient map shows desired sensitivity to the above tests, whereas specific other approaches like Guided BackProp do not. Before this, attribution research was more subjective. For example, the paper on Grad-CAM goes in-depth over how their saliency map can help aid in providing explanations or identifying bias for the dataset. But they do not consider the sensitivity of their approach to model parameters.
In the above paper on sanity-checks, they find that Grad-CAM is sensitive to changes in the input, which is good, but I definitely would like to see these sanity-checks being applied more frequently. Outside of new approaches, I think additional benchmarks for interpretability that mimic real-world use cases could be of great value to the field.
Another approach in this direction is to back-chain from the explanations that people use in everyday life to derive better benchmarks. Explanation in Artificial Intelligence: Insights from the Social Sciences provides an overview of where philosophy and social science can meet ML in the middle. Of course, the final arbiter for all this is how well people can actually use and interpret these interpretability results, which brings me to my second point.
Utility
The second area is to ensure that these interpretability approaches are actually providing value. Even if we find ways of explaining models that are actually sensitive to the learned parameters (and everything else), I think it remains to be seen if these explanations are useful in practice. At least for current techniques, I think the answer is uncertain and possibly even negative.
Manipulating and Measuring Model Interpretability, a large pre-registered study [2] from Microsoft Research, found that models with additional information like model weights were often not useful in helping users decide how to make more accurate judgments on their own or even notice when the model was wrong. Users were given either a black-box model or a more interpretable one.
They found that:
"[o]n typical examples, we saw no significant difference between a transparent model with few features and a black-box model with many features in terms of how closely participants followed the model's predictions. We also saw that people would have been better off simply following the models rather than adjusting their predictions. Even more surprisingly, we found that transparent models had the unwanted effect of impairing people's ability to correct inaccurate predictions, seemingly due to people being overwhelmed by the additional information that the transparent model presented"
Another work, Interpreting Interpretability: Understanding Data Scientists' Use of Interpretability Tools for Machine Learning, found that even data scientists may not understand what interpretable visualizations tell them. This can inspire unwarranted confidence in the underlying model, even leading to an ad-hoc rationalization of suspicious results.
Lastly, Evaluating Explainable AI: Which Algorithmic Explanations Help Users Predict Model Behavior? is a recent study of five interpretability techniques and how they empirically help humans simulate model. The authors found very few benefits from any of the methods. One noteworthy finding is that the explanations which were rated to be of higher quality by participants were not very useful in actually improving human performance.
All of this points to the difficulties ahead for interpretability research. These approaches and visuals are liable to be misused and misinterpreted. Even once we get improved notions of interpretability with intuitive properties, it remains to be seen if we can use them to achieve the benefits I listed out in the very beginning. While it certainly seems more challenging to formalize interpretability than to use it well, I'm glad that empirical tests are already being done; they can hopefully also guide where the research goes next.
Finally, lurking behind all, this is the question of decreased performance and adoption. It's obvious these days that black box models dominate in terms of results for many areas. Any additional work to induce a more interpretable model or derive a post-hoc explanation brings an additional cost. At this point, all the approaches towards improving interpretability we have seen either increase training/processing time, reduce accuracy, or do some combination of both. For those especially worried about competition, arms races, and multipolar traps, the case to adopt these approaches (past whatever token compliance will satisfy the technology ethics boards of the future) seems weak. This is also troubling.
Conclusion
As we've seen above, interpretability is a new and exciting field in machine learning. There are many creative ways to elicit an explanation from a model. The task requires a good understanding of the psychology of explanation and the technical know-how to formalize these desiderata. Future work could focus on improving how we evaluate explanations and their end usefulness to human users and overseers.
Safety should be everyone's responsibility; this brings a sense of urgency to improving this area as AI capabilities steadily increase. These interpretability methods often add additional training time and come with a performance penalty on the task. An open question is: How can we encourage the adoption of interpretability methods when the benefits aren't easily seen, but the costs are immediately visible? In addition to further research, this will likely also involve public commitments and outreach about the risks of foregoing interpretability. Efforts like the Partnership on AI and the safety teams at OpenAI and DeepMind are steps in the right direction, and I would like to see more like this in the future.
Author Bio
Owen Shen is a senior studying Computer Science at UC San Diego. He is interested in machine learning interpretability and, more broadly, AI safety. In his spare time, he also does coin magic. He blogs over at mlu.red, and his current side project is putting GAN-generated pixel monsters on the blockchain (link to 0xmons.xyz).
Footnotes
- One approach towards achieving this for neural nets is tree regularization which adds a regularization term that corresponds (roughly) to the size of the decision tree that can approximate the net being trained. The hope here is to eventually output a shallow decision tree that performs comparably to a neural net. Another approach is neural-backed decision trees which use a different form of regularization to learn a hierarchy over class labels, which is then used to form a decision tree.
- Pre-registered studies state their hypotheses ahead of time, as opposed to exploratory analysis. This can avoid certain validity issues because you avoid conditioning your tests on the data observed.
- Connected Papers was used to explore related papers quickly. The code used to generate the images and the ML models used can be found on Github.
References
- Lipton, Zachary C. "The mythos of model interpretability." Queue 16.3 (2018): 31-57.
- Fong, Ruth, Mandela Patrick, and Andrea Vedaldi. "Understanding deep networks via extremal perturbations and smooth masks." Proceedings of the IEEE International Conference on Computer Vision. 2019.
- Guidotti, Riccardo, et al. "A survey of methods for explaining black box models." ACM computing surveys (CSUR) 51.5 (2018): 1-42.
- Xie, Ning, et al. "Explainable deep learning: A field guide for the uninitiated." arXiv preprint arXiv:2004.14545 (2020).
- Murdoch, W. James, et al. "Definitions, methods, and applications in interpretable machine learning." Proceedings of the National Academy of Sciences 116.44 (2019): 22071-22080.
- Roscher, Ribana, et al. "Explainable machine learning for scientific insights and discoveries." IEEE Access 8 (2020): 42200-42216.
- Adebayo, Julius, et al. "Sanity checks for saliency maps." Advances in Neural Information Processing Systems. 2018.
- Selvaraju, Ramprasaath R., et al. "Grad-cam: Visual explanations from deep networks via gradient-based localization." Proceedings of the IEEE international conference on computer vision. 2017.
- Miller, Tim. "Explanation in artificial intelligence: Insights from the social sciences." Artificial Intelligence 267 (2019): 1-38.
- Poursabzi-Sangdeh, Forough, et al. "Manipulating and measuring model interpretability." arXiv preprint arXiv:1802.07810 (2018).
- Kaur, Harmanpreet, et al. "Interpreting Interpretability: Understanding Data Scientists' Use of Interpretability Tools for Machine Learning." Proceedings of the 2020 CHI Conference on Human Factors in Computing Systems. 2020.
- Hase, Peter, and Mohit Bansal. "Evaluating Explainable AI: Which Algorithmic Explanations Help Users Predict Model Behavior?." arXiv preprint arXiv:2005.01831 (2020).
Credits
Feature image and last image from Adebayo, Julius, et al.
Citation
For attribution in academic contexts or books, please cite this work as
Owen Shen, "Interpretability in ML: A Broad Overview", The Gradient, 2020.
BibTeX citation:
@article{shen2020interpretability,
author = {Shen, Owen},
title = {Interpretability in ML: A Broad Overview},
journal = {The Gradient},
year = {2020},
howpublished = {\url{https://thegradient.pub/interpretability-in-ml-a-broad-overview/ } },
}
If you enjoyed this piece and want to hear more, subscribe to the Gradient and follow us on Twitter.

