Imagine you're building a self-driving car that needs to understand its surroundings. How would you enable your car to perceive pedestrians, bikers, and other vehicles around it in order to move safely? You could use a camera for this, but that doesn't seem particularly effective: you'd be taking a 3D environment, "squashing" it down into a 2D image captured from the camera, and then trying to recover the 3D information you actually care about (like the distances to pedestrians or cars in front of you) from that 2D image. By squashing your 3D surroundings down to a 2D image, you're throwing out a lot of the information that matters most to you. Trying to piece this information back together is difficult and, even for state-of-the-art algorithms, error-prone.
Instead, you’d ideally be able to augment your 2D view of the world with 3D data. Rather than trying to estimate distances to pedestrians or other vehicles from a 2D image, you would be able to locate these objects directly through your sensor. But now another part of the pipeline becomes difficult: the perception. How do you actually recognize objects like people, bicyclists, and cars in 3D data? Traditional deep learning techniques like convolutional neural networks (CNNs), which would make identifying these objects in a 2D image straightforward, need to be adapted to work in 3D. Luckily, the problem of perception in 3D has been studied quite a bit over the past few years, and our mission in this article will be to give a brief overview of this work.
In particular, we’ll focus on recent deep learning techniques that enable 3D object classification and semantic segmentation. We'll begin by reviewing some background information on common ways to capture and represent 3D data. We'll then describe fundamental deep learning methods for three different representations of 3D data. Finally, we'll describe promising new research directions and conclude with our perspective on where the field is headed.
How do we capture and represent 3D data?
It’s clear that we need computer vision methods that can operate directly in 3D, but this presents three clear challenges: sensing, representing, and understanding 3D data.
Sensing
The process of capturing 3D data is complex. While 2D cameras are inexpensive and widespread, specialized hardware setups are typically needed for 3D sensing.
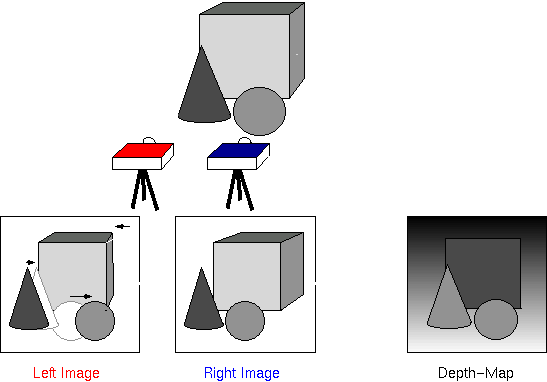
Stereo vision uses multiple cameras and measures the shift in perceived object position to compute depth information (Source: University of Edinburgh)
- Stereo fixes two or more cameras at specific positions relative to one another and uses this setup to capture different images of a scene, match the corresponding pixels, and compute how each pixel’s position differs between the images to calculate its position in 3D space. This is roughly how humans perceive the world — our eyes capture two separate "images" of the world, and then our brains look at how an object's position differs between the views from our left and right eyes to determine its 3D position. Stereo is attractive because it involves simple hardware — just two or more ordinary cameras. However, the approach isn't great in applications where accuracy or speed matter, since using visual details to match corresponding points between the camera images is not only computationally expensive but also error-prone in environments that are textureless or visually repetitive.
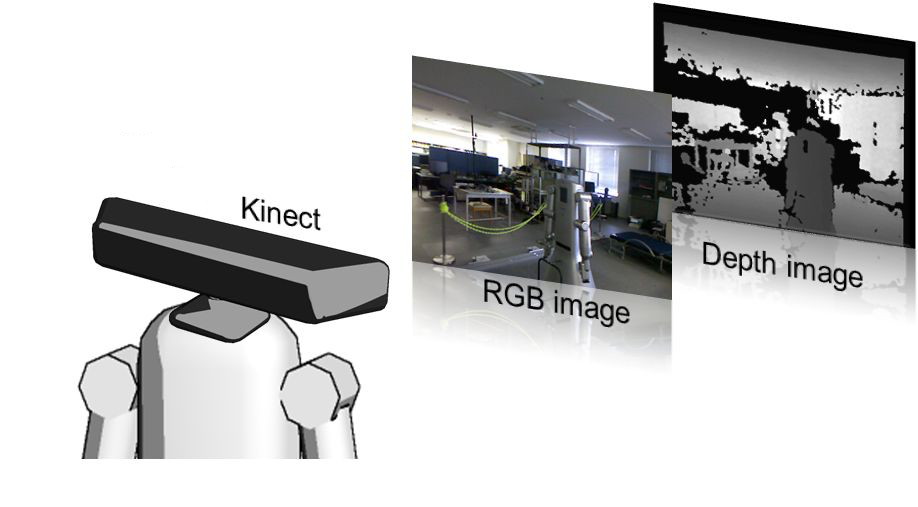
RGB-D cameras output a four-channel image that contains color information along with per-pixel depth (Source: Kyushu University)
- RGB-D involves using a special type of camera that captures depth information (“D”) in addition to a color image (“RGB”). Specifically, it captures the same type of color image you'd get from a normal 2D camera, but, for some subset of the pixels, also tells you how far in front of the camera the object is. Internally, most RGB-D sensors work through either “structured light,” which projects an infrared pattern onto a scene and senses how that pattern has warped onto the geometric surfaces, or “time of flight,” which looks at how long projected infrared light takes to return to the camera. Some RGB-D cameras you might have heard of include the Microsoft Kinect and the iPhone X's Face ID sensor. RGB-D is great because these sensors are relatively small and low-cost but also fast and immune to visual matching errors. However, RGB-D cameras often have many holes in their depth output due to occlusion (where objects in the foreground block projection onto objects behind them), pattern sensing failures, and range issues (both projection and sensing becomes difficult further away from the camera).
LIDAR uses several laser beams (sensing in concentric circles) to directly perceive the geometric structure of an environment (Source: Giphy)
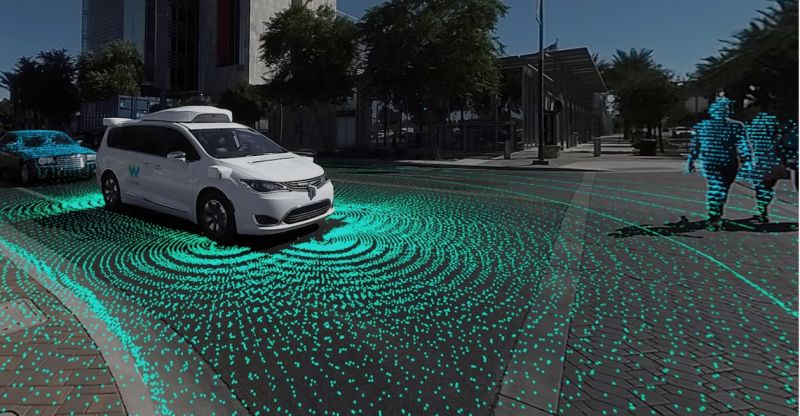
- LiDAR involves firing rapid laser pulses at objects and measuring how much time they take to return to the sensor. This is similar to the "time of flight" technology for RGB-D cameras we described above, but LiDAR has significantly longer range, captures many more points, and is much more robust to interference from other light sources. Most 3D LiDAR sensors today have several (up to 64) beams aligned vertically, spinning rapidly to see in all directions around the sensor. These are the sensors used in most self-driving cars because of their accuracy, range, and robustness, but the problem with LiDAR sensors is that they're often large, heavy, and extremely expensive (the 64-beam sensor that most self-driving cars use costs $75,000!). As a result, many companies are currently trying to develop cheaper “solid state LiDAR” systems that can sense in 3D without having to spin.
3D Representations
Once you've captured 3D data, you need to represent it in a format that makes sense as an input to the processing pipeline you’re building. There are four main representations you should know:
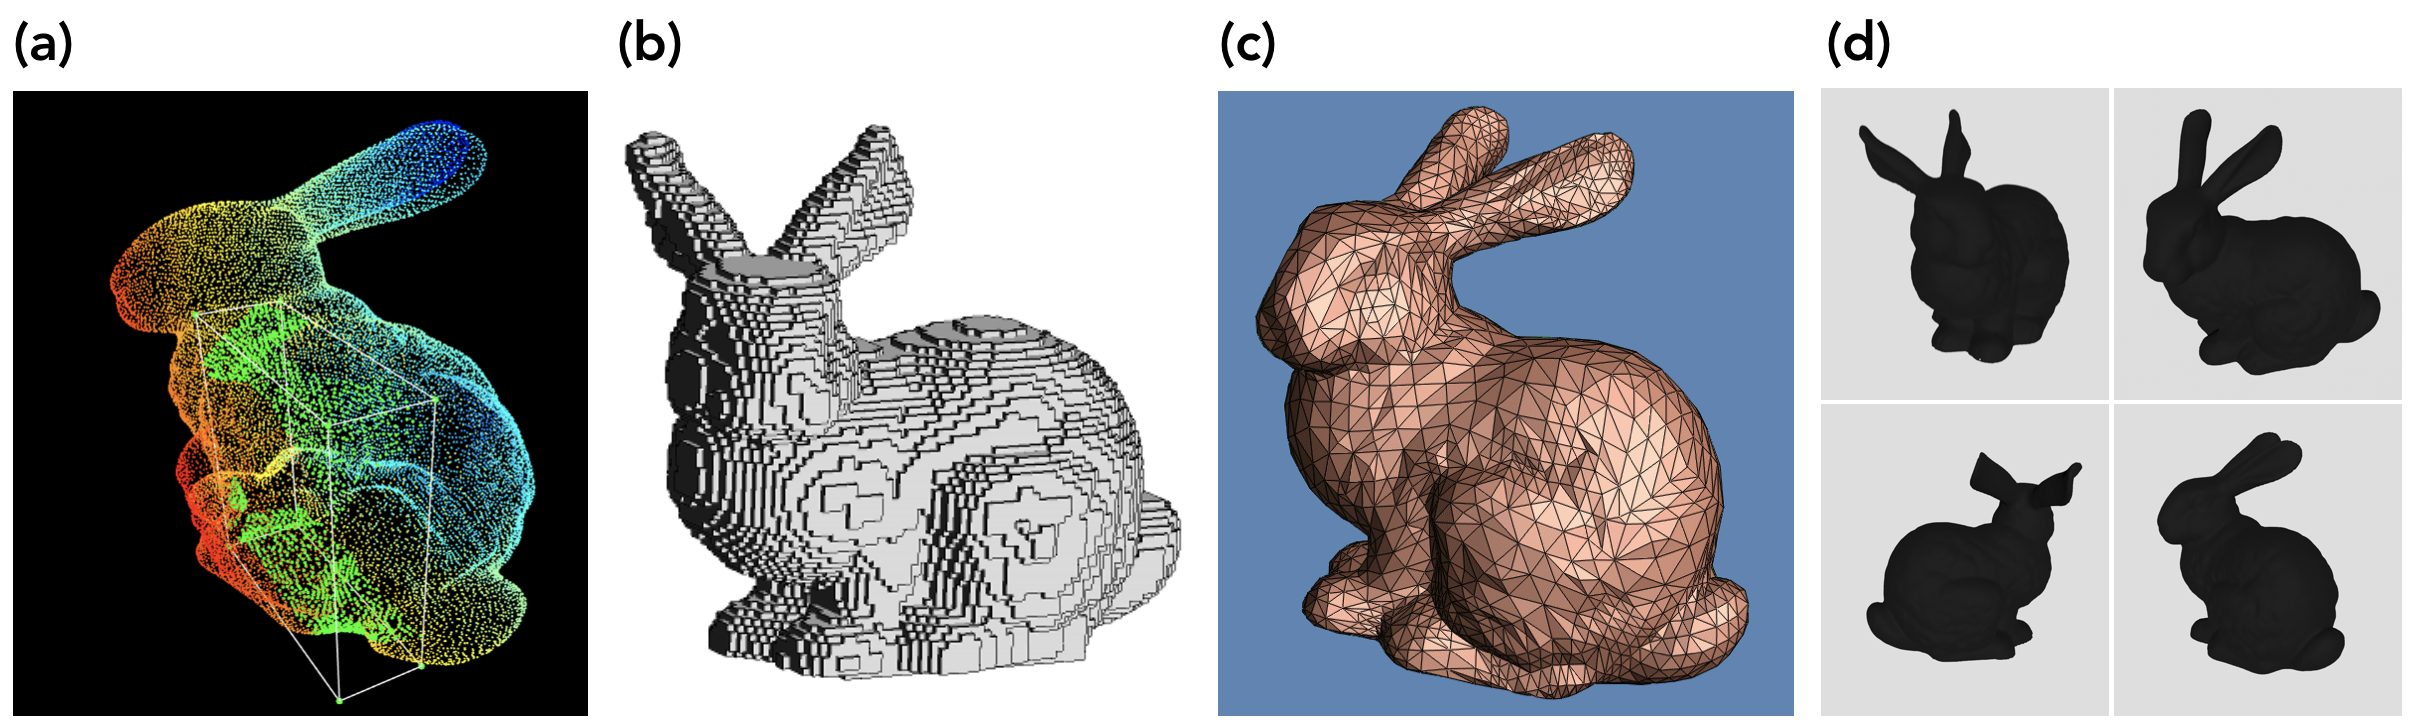
The different representations of 3D data. (a) point cloud (source: Caltech), (b) voxel grid (source: IIT Kharagpur), (c) triangle mesh (source: UW), (d) multi-view representation (source: Stanford)
a. Point clouds are simply collections of points in 3D space; each point is specified by an (xyz) location, optionally along with some other attributes (like rgb color). They’re the raw form that LiDAR data is captured in, and stereo and RGB-D data (which consist of an image labeled with per-pixel depth values) are usually converted into point clouds before further processing.
b. Voxel grids are derived from point clouds. "Voxels" are like pixels in 3D; think of voxel grids as quantized, fixed-sized point clouds. Whereas point clouds can have an infinite number of points anywhere in space with floating-point pixel coordinates, voxel grids are 3D grids in which each cell, or “voxel,” has a fixed size and discrete coordinates.
c. Polygon meshes consist of a set of polygonal faces with shared vertices that approximate a geometric surface. Think of point clouds as a collection of sampled 3D points from an underlying continuous geometric surface; polygon meshes aim to represent those underlying surfaces in a way that can be easily rendered. While originally created for computer graphics, polygon meshes can also be useful for 3D vision. There are several methods to obtain polygon meshes from point clouds, including Kazhdan et al.'s Poisson surface reconstruction[1] (2006).
d. Multi-view representations are collections of 2D images of a rendered polygon mesh captured from different simulated viewpoints ("virtual cameras") to convey the 3D geometry in a simple way. The difference between simply capturing images from multiple cameras (like in stereo) and constructing a multi-view representation is that multi-view requires actually building a full 3D model and rendering it from several arbitrary viewpoints to fully convey the underlying geometry. Unlike the other three representations above, which are used for both storage and processing of 3D data, multi-view representations are typically only used to turn 3D data into an easy format for processing or visualization.
Understanding
Now that you've turned your 3D data into a digestible format, you need to actually build out a computer vision pipeline to understand it. The problem here is that extending traditional deep learning techniques that work well on 2D images (like CNNs) to operate on 3D data can be tricky depending on the representation of that data, making conventional tasks like object detection or segmentation challenging.
Learning with multi-view inputs
Using a multi-view representation of 3D data is the simplest way to adapt 2D deep learning techniques to 3D. It's a clever way to transform the problem of 3D perception into one of 2D perception, but in a way that still allows you to reason about the 3D geometry of an object. The early deep learning-based work to use this idea was Su et al.'s multi-view CNN[2] (2015), a simple yet effective architecture that can learn a feature descriptor from multiple 2D views of a 3D object. Implementing this approach, the method had increased performance compared to using a single 2D image for the object classification task. This is accomplished by feeding in individual images into a VGG network pre-trained on ImageNet in order to extract salient features, pooling these resulting activation maps, and passing this information into additional convolutional layers for further feature learning.
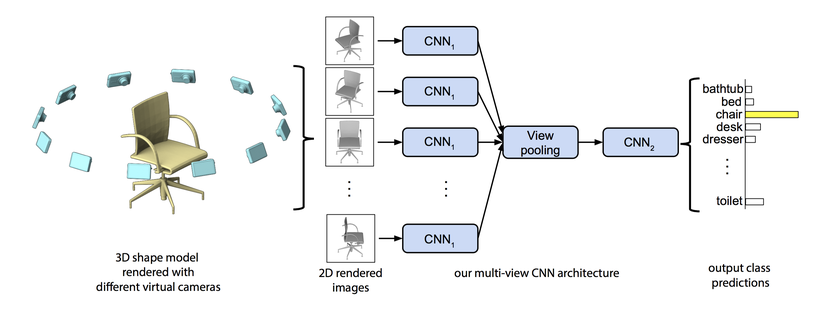
Multi-view CNN architecture (Source: paper)
Still, multi-view image representations have numerous limitations. The main issue is that you aren't truly learning in 3D — a fixed number of 2D views is still just an imperfect approximation of an underlying 3D structure. As a result, tasks like semantic segmentation, especially across more complex object and scenes, become challenging because of the limited feature information gained from 2D images. Moreover, this form of visualizing 3D data is not scalable for computationally constrained tasks like autonomous driving and virtual reality — keep in mind that generating a multi-view representation requires rendering a full 3D model and simulating several arbitrary viewpoints. Ultimately, multi-view learning is faced with many drawbacks that motivates research on methods that learn directly from 3D data.
Learning with volumetric representations
Learning with voxel grids solves the main drawbacks of multi-view representations. Voxel grids bridge the gap between 2D and 3D vision — they're the closest 3D representation to images, making it relatively easy to adapt 2D deep learning concepts (like the convolution operator) to 3D. Maturana and Scherer's VoxNet[3] (2015) was one of the first deep learning methods to achieve compelling results on the object classification task given a voxel grid input. VoxNet operates on probabilistic occupancy grids, in which each voxel contains the probability that that voxel is occupied in space. A benefit of this approach is that it allows the network to differentiate between voxels that are known to be free (e.g., voxels a LiDAR beam passed through) and voxels whose occupancy is unknown (e.g., voxels behind where a LiDAR beam hit).
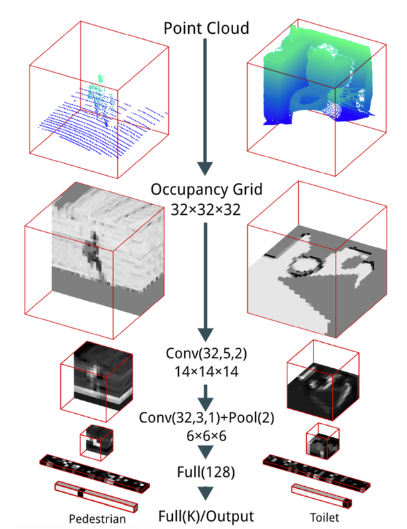
VoxNet architecture (Source: paper)
VoxNet's architecture itself is fairly straightforward, consisting of two convolutional layers, a max pooling layer, and two fully-connected layers to compute an output class score vector. This network is much shallower and has far fewer parameters than most state-of-the-art image classification networks, but it was selected from a stochastic search over hundreds of possible CNN architectures. Since voxel grids are so similar to images, the actual strided convolution and pooling operators they employ are trivial adaptations of these operators from working on 2D pixels to 3D voxels; the convolution operator uses a $d \times d \times d \times c$ kernel rather than the $d \times d \times c$ kernel used in 2D CNNs, and the pooling operator considers non-overlapping 3D blocks of voxels rather than 2D blocks of pixels.
One issue with VoxNet is that the architecture isn't inherently rotation-invariant. While the authors reasonably assume that the sensor is kept upright so that the $z$ axis of the voxel grid is aligned with the direction of gravity, no such assumptions can be made about rotation about the $z$ axis — an object from behind is still that same object, even though the geometry in the voxel grid would interact with the learned convolution kernel very differently. To solve this, they employ a simple data augmentation strategy. During training, they rotate each model several times and train on all copies; then, at test time, they pool the output of the final fully-connected layer across several rotations of the input. They note that this approach led to similar performance but faster convergence compared to pooling the output of intermediate convolutional layers like Su et al.'s multi-view CNNs do in their "view pooling" step. In this way, VoxNet learns rotation invariance by sharing the same learned convolutional kernel weights across different rotations of the input voxel grid.
VoxNet represents a huge step towards true 3D learning, but voxel grids still have a number of drawbacks. First, they lose resolution compared to point clouds, since several distinct points representing intricate structures will be binned into one voxel if they're close together. At the same time, voxel grids can lead to unnecessarily high memory usage compared to point clouds in sparse environments, since they actively consume memory to represent free and unknown space whereas point clouds contain only known points.
Learning with point clouds
PointNet
In light of these issues with voxel-based approaches, recent work has focused on architectures that operate directly on raw point clouds. Most notably, Qi et al.'s PointNet[4] (2016) was one of the first proposed methods for handling this form of irregular 3D data. However, as noted by the authors, point clouds are simply a set of points represented in 3D by their xyz locations. More concretely, given $N$ points in a point cloud, the network needs to learn unique features that are invariant to the $N!$ permutations of this input data, since the ordering of points fed into a network doesn't impact the underlying geometry. In addition, the network should be robust to transformations of the point cloud — rotations, translations and scaling should not impact prediction.
To ensure invariance across input ordering, the key insight behind PointNet is using a simple symmetric function that produces a consistent output for any ordering of the input (examples in this class of functions include addition and multiplication). Guided by this intuition, the basic module behind the PointNet architecture (called PointNet Vanilla) is defined as follows:
$$f(x_1, \ldots, x_n) = \gamma \odot g(h(x_1), \ldots, h(x_n))$$
where $f$ is a symmetric function that transforms input points into a $k$-dimensional vector (for object classification). This function $f$ can be approximated such that there exists another symmetric function $g$. In the equation, $h$ is a multi-layer perceptron (MLP) that maps individual input points (and their corresponding features such as xyz position, color, surface normals, etc.) into a higher dimensional latent space. The max-pooling operations serves as the symmetric function $g$, aggregating learned features into a global descriptor for the point cloud. This single feature vector is passed into $\gamma$, another MLP that outputs predictions for objects.
To address the challenge of learning representations that are invariant to geometric transformations of the point cloud, PointNet employs a mini-network, called T-Net, which applies an affine transformation onto the input point cloud. The concept is similar to Jaderberg et al.'s spatial transformer networks[5] (2016) but is much simpler because there is no need for defining a new type of layer. T-Net consists of learnable parameters that enable PointNet to transform the input point cloud into a fixed, canonical space — ensuring that the overall network is robust to even the slightest of variations.
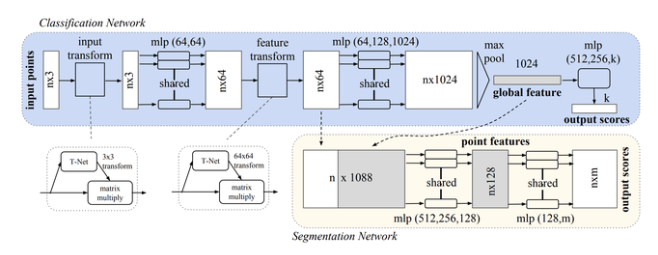
PointNet architecture (Source: paper)
The overall PointNet architecture integrates the vanilla approach and T-Net with multiple MLP layers that create feature representations for the point clouds. However, beyond just object classification, PointNet also enables semantic segmentation of both objects and scenes. To accomplish this, the architecture combines the global feature vector from the max pooling symmetric function with per-point features learned after the input data is passed through a few MLPs. By concatenating these two vectors, each point is aware of both its global semantics and its local features, enabling the network to learn additional, more meaningful features that help with segmentation.
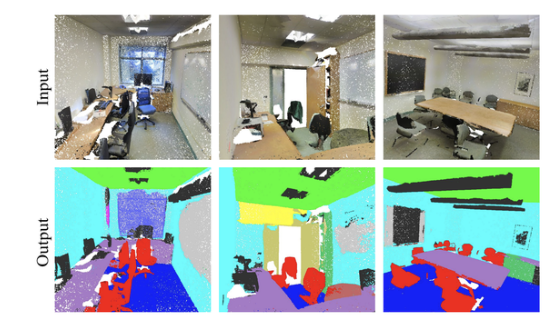
Semantic segmentation results of indoor scenes using PointNet (Source: paper)
PointNet++
Despite the impressive results with PointNet, one of the primary drawbacks is that the architecture fails to capture the underlying local structure within neighborhoods of points — an idea that is similar to extracting features from increasing receptive field sizes in images using CNNs. To address this issue, Qi et al. developed PointNet++[6] (2017), a spinoff from the PointNet architecture but is also capable of learning features from local regions within a point cloud. The basis behind this method is a hierarchical feature learning layer that has three key steps. It (1) samples points to serve as centroids for the local region, (2) groups neighboring points in these local regions based on distance from the centroid, and (3) encodes features for these regions using a mini-PointNet.
These steps are progressively repeated so that features are learned across varying sizes of point groups within the point cloud. In doing so, the network can better understand the underlying relationships within local clusters of points across the entire point cloud — ultimately aiding in improved generalization performance. The results of this work demonstrate that PointNet++ enables significant improvements over existing methods including PointNet, and achieved state-of-art performance on 3D point cloud analysis benchmarks (ModelNet40 and ShapeNet)
Promising new research areas
Graph CNNs
Current research on deep learning architectures for processing 3D data has been focused on point cloud representations, with much of the recent work extending ideas from PointNet/PointNet++ and drawing inspiration from other fields to further improve performance. An example of one such paper is Wang et al.'s Dynamic Graph CNNs[7] (2018), which uses graph-based deep learning methods to improve feature extraction in point clouds. The idea is that PointNet and PointNet++ fail to capture the geometric relationships among individual points because these methods need to maintain invariance to different input permutations. However, by considering a point and it's surrounding nearest neighbors as a directed graph, Wang et al. construct EdgeConv, an operator that generates unique features across points in the data. Read another Gradient overview if you are interested in learning more about learning on graphs.
SPLATNet
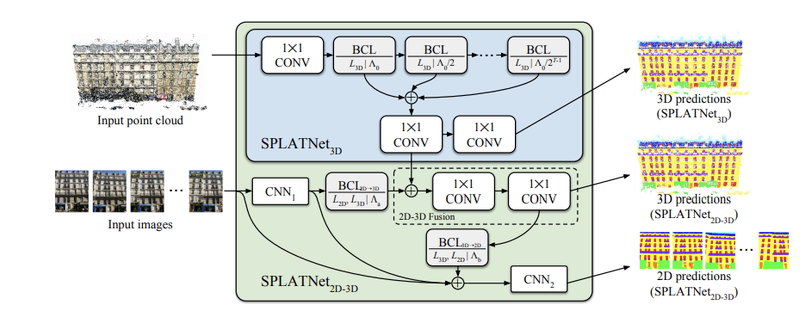
SPLATNet architecture (Source: paper)
On the other hand, some research has taken a step away from the classic feature extraction methods proposed in PointNet/PointNet++, opting to design a new method for processing point clouds all together. Su et al.'s SPLATNet (2018)[8] architecture is a great example of this new focus in point cloud research — the authors design a novel architecture and convolution operator than can directly operate on point clouds. The key insight behind this paper is translating the concept of "receptive fields" to irregular point clouds, which enables spatial information to be preserved even across sparse regions (a key drawback with PointNet/PointNet++). What's especially fascinating is that SPLATNet can project features extracted from multi-view images into 3D space, fusing this 2D data with the original point cloud in an end-to-end learnable architecture. Using this 2D-3D joint learning, SPLATNet achieved a new state-of-the-art in semantic segmentation.
Frustum PointNets
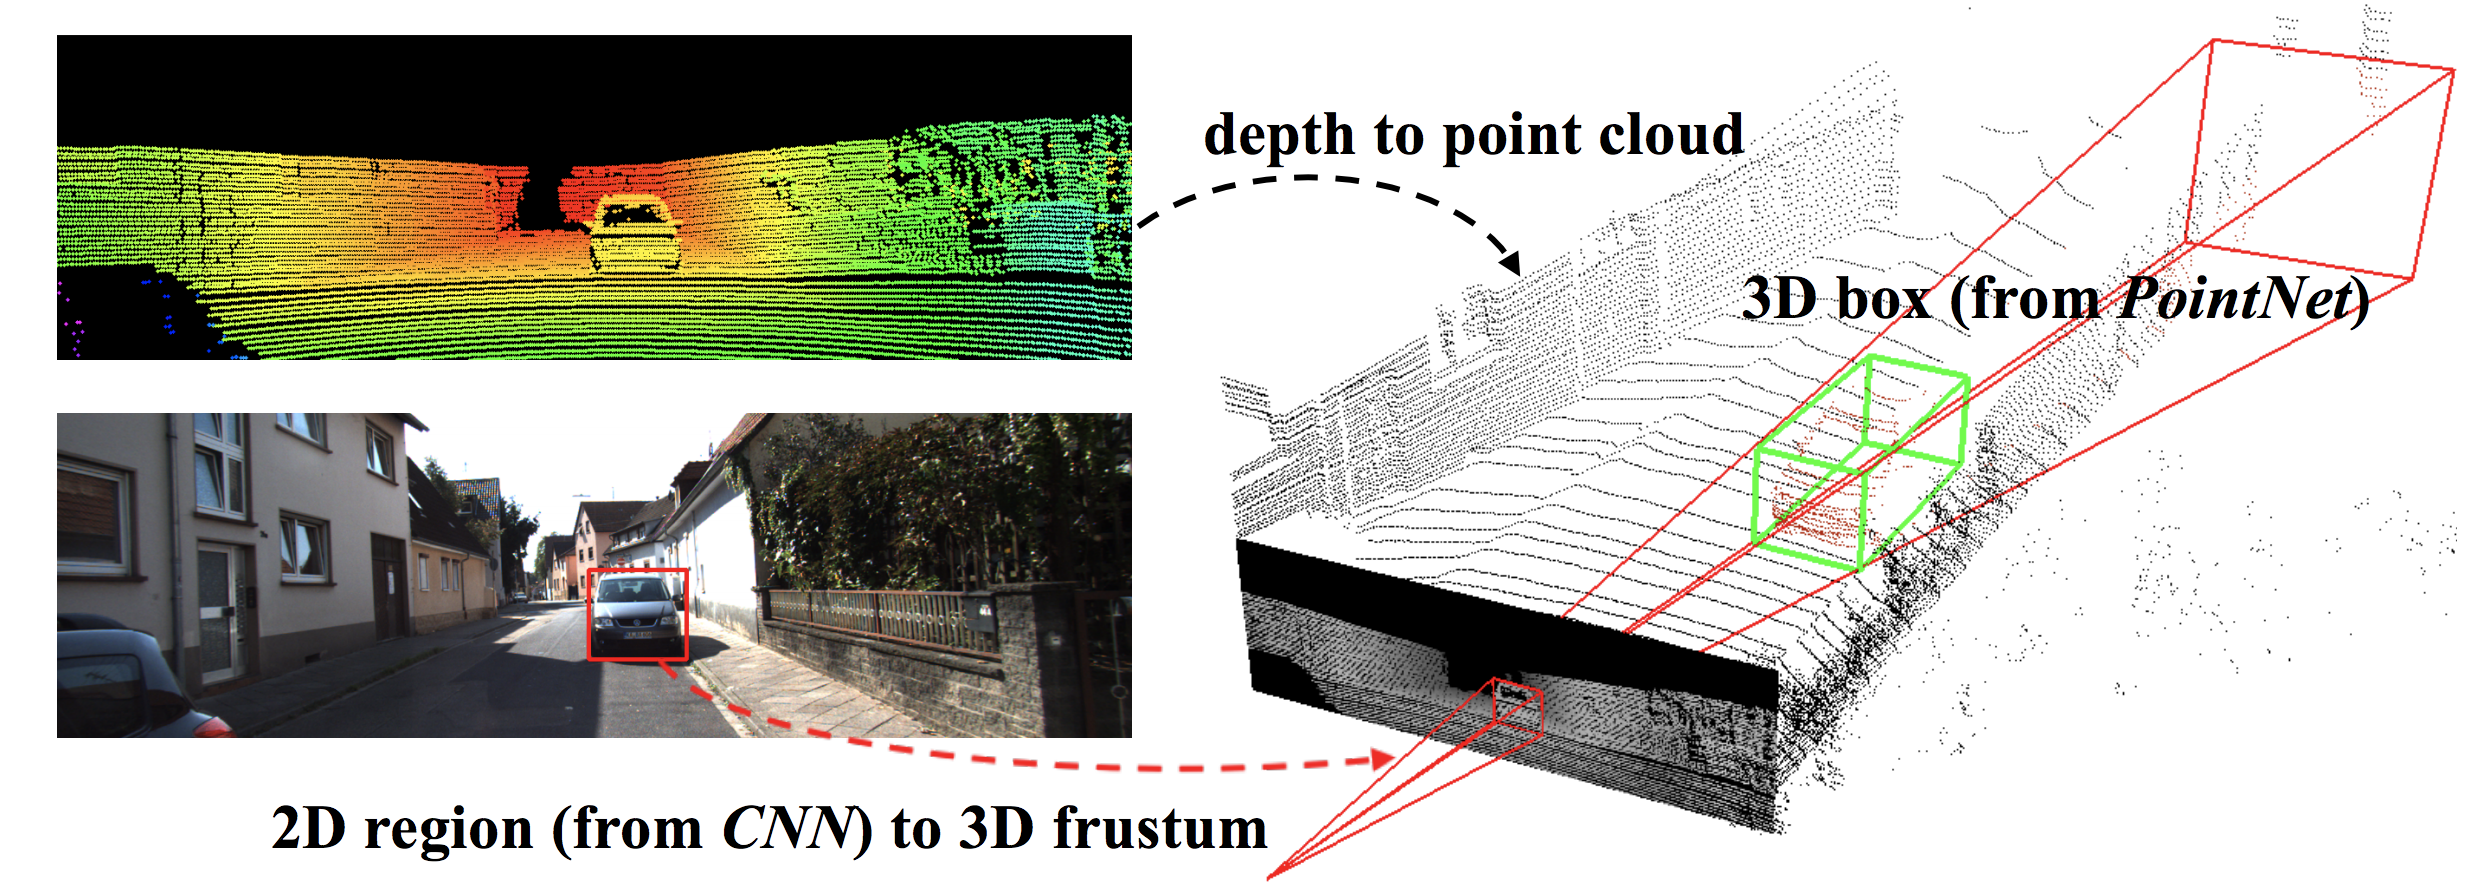
Visualizing a 3D frustum generated from a 2D bounding box estimation (Source: paper)
A third promising reserach direction involves extending the basic architectural building blocks we described above to build more elaborate networks for useful tasks like object detection in 3D. Building on the idea of using both 2D and 3D data, Qi et al.’s Frustum PointNets[9] (2017) presents a new approach that fuses RGB images with point clouds to improve the efficiency of localizing objects in large 3D scenes. Conventional approaches for this task determine possible 3D bounding boxes for objects by performing classification on sliding windows directly over the entire point cloud, which is computationally expensive and makes real-time prediction difficult. Qi et al. make two key contributions.
First, they propose to initially use a standard CNN for object detection on 2D images, extrude a 3D frustum corresponding to the region of the point cloud in which the detected object could reside, and then perform the search process over only this "slice" of the point cloud. This significantly narrows down the search space for bounding box estimation, reducing the likelihood of false detections and considerably speeding up the processing pipeline, which is crucial for autonomous driving applications.
Second, instead of performing the typical sliding window classification to during the bounding box search process, Qi et al. design a novel PointNet-based architecture that can directly perform instance segmentation (segmenting the point cloud into individual objects) and bounding box estimation over the entire 3D frustum in one pass, making their method both fast and robust to occlusions and sparsity. Ultimately, as a result of these improvements, this work outperformed all prior approaches at the time of publication on the KITTI and SUN RGB-D 3D detection benchmarks.
Final thoughts
Over just the past 5 years, 3D deep learning methods have progressed from working with derived (multi-view) to raw (point cloud) representations of 3D data. Along the way, we've moved from methods that were simple adaptations of 2D CNNs to 3D data (multi-view CNNs and even VoxNet) to methods that were handcrafted for 3D (PointNet and other point cloud methods), greatly improving performance on tasks like object classification and semantic segmentation. These results are promising because they confirm that there truly is value in seeing and representing the world in 3D.
However, advancements in this field have just begun. Current work focuses not only on improving the accuracy and performance of these algorithms, but also on ensuring robustness and scalability. And although much of the current research is motivated by autonomous vehicle applications, new methods operating directly on point clouds will play a significant role in 3D medical imaging, virtual reality, and indoor mapping.
(Cover image: Waymo)
Mihir Garimella and Prathik Naidu are rising sophomores at Stanford University majoring in Computer Science. They’ve done research in robotics, computer vision, and machine learning and have industry experience at Facebook’s Connectivity Lab and Amazon’s CoreAI team, respectively. They're the co-founders of Firefly Autonomy, an early-stage startup building autonomous drones for indoor mapping and industrial inspection.
Citation
For attribution in academic contexts or books, please cite this work as
Mihir Garimella and Prathik Naidu, "Beyond the pixel plane: sensing and learning in 3D", The Gradient, 2018.
BibTeX citation:
@article{GarimellaNaidu2018Gradient,
author = {Mihir Garimella, Prathik Naidu}
title = {Beyond the pixel plane: sensing and learning in 3D},
journal = {The Gradient},
year = {2018},
howpublished = {\url{https://thegradient.pub/beyond-the-pixel-plane-sensing-and-learning-in-3d } },
}
If you enjoyed this piece and want to hear more, subscribe to the Gradient and follow us on Twitter.
Kazhdan, Michael, and Hugues Hoppe. "Screened poisson surface reconstruction." ACM Transactions on Graphics (ToG) 32.3 (2013): 29. ↩︎
Su, Hang, et al. "Multi-view convolutional neural networks for 3d shape recognition." Proceedings of the IEEE international conference on computer vision. 2015. ↩︎
Maturana, Daniel, and Sebastian Scherer. "Voxnet: A 3d convolutional neural network for real-time object recognition." Intelligent Robots and Systems (IROS), 2015 IEEE/RSJ International Conference on. IEEE, 2015. ↩︎
Qi, Charles R., et al. "Pointnet: Deep learning on point sets for 3d classification and segmentation." Proc. Computer Vision and Pattern Recognition (CVPR), IEEE 1.2 (2017): 4. ↩︎
Jaderberg, Max, Karen Simonyan, and Andrew Zisserman. "Spatial transformer networks." Advances in neural information processing systems. 2015. ↩︎
Qi, Charles Ruizhongtai, et al. "Pointnet++: Deep hierarchical feature learning on point sets in a metric space." Advances in Neural Information Processing Systems. 2017. ↩︎
Wang, Yue, et al. "Dynamic graph CNN for learning on point clouds." arXiv preprint arXiv:1801.07829 (2018). ↩︎
Su, Hang, et al. "Splatnet: Sparse lattice networks for point cloud processing." Proceedings of the IEEE Conference on Computer Vision and Pattern Recognition. 2018. ↩︎
Qi, Charles R., et al. "Frustum pointnets for 3d object detection from rgb-d data." arXiv preprint arXiv:1711.08488 (2017). ↩︎
