The history of each living being is written in its genome, which is stored as DNA and present in nearly every cell of the body. No two cells are the same, even if they share the same DNA and cell type, as they still differ in the regulators that control how DNA is expressed by the cell. The human genome consists of 3 billion base pairs spread over 23 chromosomes. Within this vast genetic code, there are approximately 20,000 to 25,000 genes, constituting the protein-coding DNA and accounting for about 1% of the total genome [1]. To explore the functioning of complex systems in our bodies, especially this small coding portion of DNA, a precise sequencing method is necessary, and single-cell sequencing (sc-seq) technology fits this purpose.
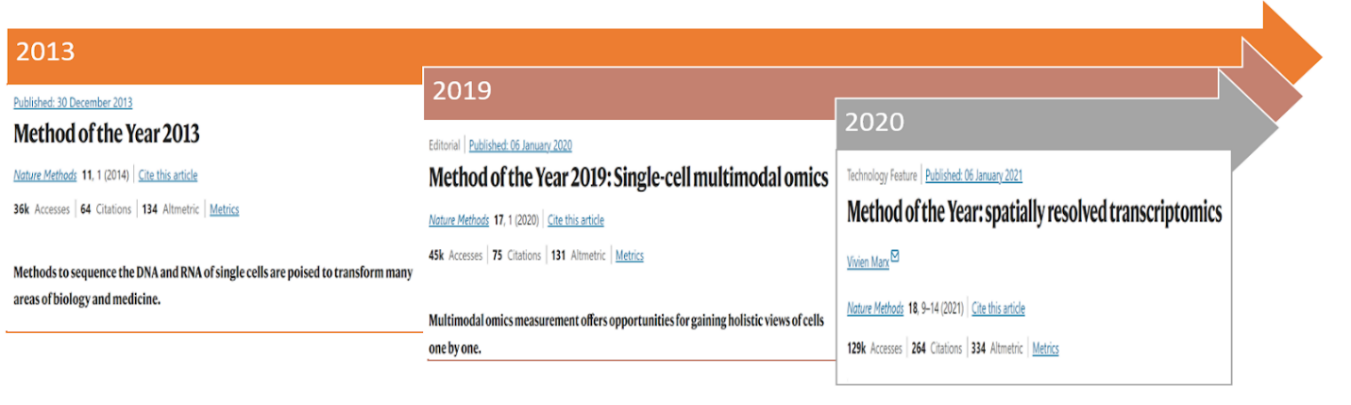
In 2013, Nature selected single-cell RNA sequencing as the Method of the Year [2] (Figure 3), highlighting the importance of this method for exploring cellular heterogeneity through the sequencing of DNA and RNA at the individual cell level. Subsequently, numerous tools have emerged for the analysis of single-cell RNA sequencing data. For example, the scRNA-tools database has been compiling software for the analysis of single-cell RNA data since 2016, and by 2021, the database includes over 1000 tools [3]. Among these tools, many involve methods that leverage Deep Learning techniques, which will be the focus of this article – we will explore the pivotal role that Deep Learning, in particular, has played as a key enabler for advancing single-cell sequencing technologies.
Background
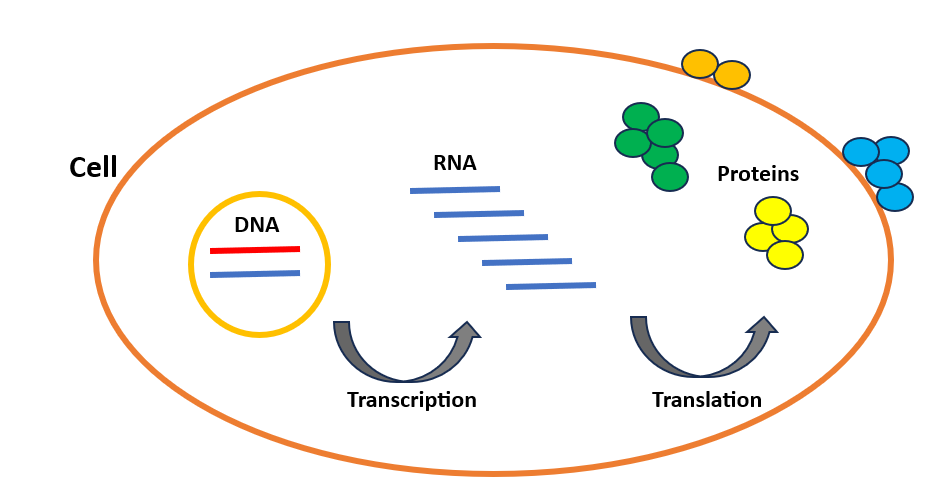
Flow of genetic information from DNA to protein in cells
Let’s first go over what exactly cells and sequences are. The cell is the fundamental unit of our bodies and the key to understanding how our bodies function in good health and how molecular dysfunction leads to disease. Our bodies are made of trillions of cells, and nearly every cell contains three genetic information layers: DNA, RNA, and protein. DNA is a long molecule containing the genetic code that makes each person unique. Like a source code, it includes several instructions showing how to make each protein in our bodies. These proteins are the workhorses of the cell that carry out nearly every task necessary for cellular life. For example, the enzymes that catalyze chemical reactions within the cell and DNA polymerases that contribute to DNA replication during cell division, are all proteins. The cell synthesizes proteins in two steps: Transcription and Translation (Figure 1), which are known as gene expression. DNA is first transcribed into RNA, then RNA is translated into protein. We can consider RNA as a messenger between DNA and protein.
While the cells of our body share the same DNA, they vary in their biological activity. For instance, the distinctions between immune cells and heart cells are determined by the genes that are either activated or deactivated in these cells. Generally, when a gene is activated, it leads to the creation of more RNA copies, resulting in increased protein production. Therefore, as cell types differ based on the quantity and type of RNA/protein molecules synthesized, it becomes intriguing to assess the abundance of these molecules at the single-cell level. This will enable us to investigate the behavior of our DNA within each cell and attain a high-resolution perspective of the various parts of our bodies.
In general, all single-cell sequencing technologies can be divided into three main steps:
- Isolation of single cells from the tissue of interest and extraction of genetic material from each isolated cell
- Amplification of genetic material from each isolated cell and library preparation
- Sequencing of the library using a next-generation sequencer and data analysis
Navigating through the intricate steps of cellular biology and single-cell sequencing technologies, a pivotal question emerges: How is single-cell sequencing data represented numerically?
Structure of single-cell sequencing data
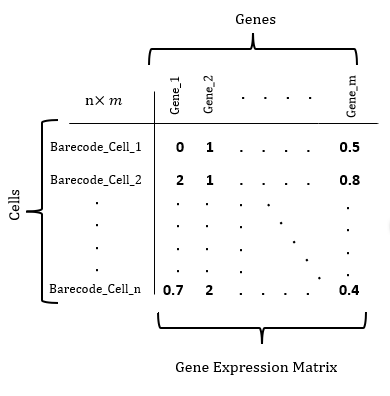
The structure of single-cell sequencing data takes the form of a matrix (Figure 2), where each row corresponds to a cell that has been sequenced and annotated with a unique barcode. The number of rows equals the total number of cells analyzed in the experiment. On the other hand, each column corresponds to a specific gene. Genes are the functional units of the genome that encode instructions for the synthesis of proteins or other functional molecules. In the case of scRNA seq data, the numerical entries in the matrix represent the expression levels of genes in individual cells. These values indicate the amount of RNA produced from each gene in a particular cell, providing insights into the activity of genes within different cells.
Single Cell Sequencing Overview
For more than 150 years, biologists have wanted to identify all the cell types in the human body and classify them into distinct types based on accurate descriptions of their properties. The Human Cell Atlas Project (HCAP), the genetic equivalent of the Human Genome Project [4], is an international collaborative effort to map all the cells in the human body.” We can conceptualize the Human Cell Atlas as a map endeavoring to portray the human body coherently and systematically. Much like Google Maps, which allows us to zoom in for a closer examination of intricate details, the Human Cell Atlas provides insights into spatial information, internal attributes, and even the relationships among elements”, explains Aviv Regev, a computational and systems biologist at the Broad Institute of MIT and Harvard and Executive Vice President and Head of Genentech Research.
This analogy seamlessly aligns with the broader impact of single-cell sequencing, since it allows the analysis of individual cells instead of bulk populations. This technology proves invaluable in addressing intricate biological inquiries related to developmental processes and comprehending heterogeneous cellular or genetic changes under various treatment conditions or disease states. Additionally, it facilitates the identification of novel cell types within a given cellular population. The initiation of the first single-cell RNA sequencing (scRNA-seq) paper in 2009 [5], subsequently designated as the "method of the year" in 2013 [2], marked the genesis of an extensive endeavor to advance both experimental and computational techniques dedicated to unraveling the intricacies of single-cell transcriptomes.
As the technological landscape evolves, the narrative transitions to the advancements in single-cell research, particularly the early focus on single-cell RNA sequencing (scRNA-seq) due to its cost-effectiveness in studying complex cell populations.” In some ways, RNA has always been one of the easiest things to measure,” says Satija [6], a researcher at the New York Genome Center (NYGC). Yet, the rapid development of single-cell technology has ushered in a new era of possibilities—multimodal single-cell data integration. Recognized as the "Method of the Year 2019" by Nature [7] (Figure 3), this approach allows the measurement of different cellular modalities, including the genome, epigenome, and proteome, within the same cell. The layering of multiple pieces of information provides powerful insights into cellular identity, posing the challenge of effectively modeling and combining datasets generated from multimodal measurements. This integration challenge is met with the introduction of Multi-view learning [8] methods, exploring common variations across modalities. This sophisticated approach, incorporating deep learning techniques, showcases relevant results across various fields, particularly in biology and biomedicine.
Amidst these advancements, a distinct challenge surfaces in the persistent limitation of single-cell RNA sequencing—the loss of spatial information during transcriptome profiling by isolating cells from their original position. Spatially resolved transcriptomics (SRT) emerges as a pivotal solution [9], addressing the challenge by preserving spatial details during the study of complex biological systems. This recognition of spatially resolved transcriptomics as the method of the year 2020 solidifies its place as a critical solution to the challenges inherent in advancing our understanding of complex biological systems.
Having explored the panorama of single-cell sequencing, let us now delve into the role of deep learning in the context of single-cell sequencing.
Deep Learning on single-cell sequencing
Deep learning is increasingly employed in single-cell analysis due to its capacity to handle the complexity of single-cell sequencing data. In contrast, conventional machine-learning approaches require significant effort to develop a feature engineering strategy, typically designed by domain experts. The deep learning approach, however, autonomously captures relevant characteristics from single-cell sequencing data, addressing the heterogeneity between single-cell sequencing experiments, as well as the associated noise and sparsity in such data. Below are three key reasons for the application of deep learning in single-cell sequencing:
- High-Dimensional Data: Single-cell sequencing generates high-dimensional data, with thousands of genes and their expression levels measured for each cell. Deep learning models are adept at capturing complex relationships and patterns within this data, which can be challenging for traditional statistical methods.
- Non-Linearity: Single-cell gene expression data is characterized by its inherent nonlinearity between gene expressions and cell-to-cell heterogeneity. Traditional statistical methods encounter difficulties in capturing the non-linear relationships present in single-cell gene expression data. In contrast, deep learning models are flexible and able to learn complex non-linear mappings.
- Heterogeneity: Single-cell data is often characterized by diverse cell populations with varying gene expression profiles, presenting a complex landscape. Deep learning models can play a crucial role in identifying, clustering, and characterizing these distinct cell types or subpopulations, thereby facilitating a deeper understanding of cellular heterogeneity within a sample.
As we explore the reasons behind using deep learning in single-cell sequencing data, it leads us to the question: What deep learning architectures are often used in sc-seq data analysis?
Background on Autoencoders
Autoencoders (AEs) stand out among various deep-learning architectures (such as GANs and RNNs) as an especially relied upon method for decoding the complexities of single-cell sequencing data. Widely employed for dimensionality reduction while preserving the inherent heterogeneity in the single-cell sequencing data. By clustering cells in the reduced-dimensional space generated by autoencoders, researchers can effectively identify and characterize different cell types or subpopulations. This approach enhances our ability to discern and analyze the diverse cellular components within single-cell datasets. In contrast to non-deep learning models, such as principal component analysis (PCA), which are integral components of established scRNA-seq data analysis software like Seurat [10], autoencoders distinguish themselves by uncovering non-linear manifolds. While PCA is constrained to linear transformations, the flexibility of autoencoders to capture complex non-linear mappings makes it an advanced method to find nuanced relationships embedded in single-cell genomics.
To mitigate the overfitting challenge associated with autoencoders, several enhancements to the autoencoder structure have been implemented, specifically tailored to offer advantages in the context of sc-seq data. One notable adaptation often used in the context of sc-seq data is the denoising autoencoder (DAEs), which amplifies the autoencoder's reconstruction capability by introducing noise to the initial network layer. This involves randomly transforming some of its units to zero. The Denoising Autoencoder then reconstructs the input from this intentionally corrupted version, empowering the network to capture more relevant features and preventing it from merely memorizing the input (overfitting). This refinement significantly bolsters the model's resilience against data noise, thereby elevating the quality of the low-dimensional representation of samples (i.e., bottleneck) derived from the sc-seq data.
A third variation of autoencoders frequently employed in sc-seq data analysis is variational autoencoders (VAEs), exemplified by models like scGen [19], scVI [14], scANVI [28], etc. VAEs, as a type of generative model, learn a latent representation distribution of the data. Instead of encoding the data into a vector of p-dimensional latent variables, the data is encoded into two vectors of size p: a vector of means η and a vector of standard deviations σ. VAEs introduce a probabilistic element to the encoding process, facilitating the generation of synthetic single-cell data and offering insights into the diversity within a cell population. This nuanced approach adds another layer of complexity and richness to the exploration of single-cell genomics.
Applications of deep learning in sc-seq data analysis
This section outlines the main applications of deep learning in improving various stages of sc-seq data analysis, highlighting its effectiveness in advancing crucial aspects of the process.
scRNA-seq data imputation and denoising
Single-cell RNA sequencing (scRNA-seq) data encounter inherent challenges, with dropout events being a prominent concern that leads to significant issues—resulting in sparsity within the gene expression matrix, often characterized by a substantial number of zero values. This sparsity significantly shapes downstream bioinformatics analyses. Many of these zero values arise artificially due to deficiencies in sequencing techniques, including problems like inadequate gene expression, low capture rates, sequencing depth, or other technical factors. As a consequence, the observed zero values do not accurately reflect the true underlying expression levels. Hence, not all zeros in scRNA-seq data can be considered mere missing values, deviating from the conventional statistical approach of imputing missing data values. Given the intricate distinction between true and false zero counts, traditional imputation methods with predefined missing values may prove inadequate for scRNA-seq data. For instance, a classical imputation method, like Mean Imputation, might entail substituting these zero values with the average expression level of that gene across all cells. However, this approach runs the risk of oversimplifying the complexities introduced by dropout events in scRNA-seq data, potentially leading to biased interpretations.
ScRNA-seq data imputation methods can be divided into two categories: deep learning–based imputation method and non–deep learning imputation method. The non–deep learning imputation algorithms involve fitting statistical probability models or utilizing the expression matrix for smoothing and diffusion. This simplicity renders it effective for certain types of samples. For example, Wagner et al. [11] utilized the k-nearest neighbors (KNN) method, identifying nearest neighbors between cells and aggregating gene-specific Unique Molecular Identifiers (UMI) counts to impute the gene expression matrix. In contrast, Huang et al. [12] proposed the SVAER algorithm, leveraging gene-to-gene relationships for imputing the gene expression matrix. For larger datasets (comprising tens of thousands or more), high-dimensional, sparse, and complex scRNA-seq data, traditional computational methods face difficulties, often rendering analysis using these methods difficult and infeasible. Consequently, many researchers have turned to designing methods based on deep learning to address these challenges.
Most deep learning algorithms for imputing dropout events are based on autoencoders (AEs). For instance, in 2018, Eraslan et al. [13] introduced the deep count autoencoder (DCA). DCA utilizes a deep autoencoder architecture to address dropout events in single-cell RNA sequencing (scRNA-seq) data. It incorporates a probabilistic layer in the decoder to model the dropout process. This probabilistic layer accommodates the uncertainty associated with dropout events, enabling the model to generate a distribution of possible imputed values. To capture the characteristics of count data in scRNA-seq, DCA models the observed counts as originating from a negative binomial distribution.
Single-cell variational inference (scVI) is another deep learning algorithm introduced by Lopez et al. [14]. ScVI is a probabilistic variational autoencoder (VAE) that combines deep learning and probabilistic modeling to capture the underlying structure of the scRNA-seq data. ScVI can be used for imputation, denoising, and various other tasks related to the analysis of scRNA-seq data. In contrast to the DCA model, scVI employs Zero-Inflated Negative Binomial (ZINB) distribution in the decoder part to generate a distribution of possible counts for each gene in each cell. The Zero-Inflated Negative Binomial (ZINB) distribution allows modeling the probability of a gene expression being zero (to model dropout events) as well as the distribution of positive values (to model non-zero counts).
Additionally, another study addressed the scRNA-seq data imputation challenge by introducing a recurrent network layer in their model, known as scScope [15]. This novel architecture iteratively performs imputations on zero-valued entries of input scRNA-seq data. The flexibility of scScope's design allows for the iterative improvement of imputed outputs through a chosen number of recurrent steps (T). Noteworthy is the fact that reducing the time recurrence of scScope to one (i.e., T = 1) transforms the model into a traditional autoencoder (AE). As scScope is essentially a modification of traditional AEs, its runtime is comparable to other AE-based models.
It's important to note that the application of deep learning in scRNA-seq data imputation and denoising is particularly advantageous due to its ability to capture non-linear relationships among genes. This contrasts with standard linear approaches, making deep learning more adept at providing informed and accurate imputation strategies in the context of single-cell genomics.
Batch effect removal
Single-cell data is commonly aggregated from diverse experiments that vary in terms of experimental laboratories, protocols, sample compositions, and even technology platforms. These differences result in significant variations or batch effects within the data, posing a challenge in the analysis of biological variations of interest during the process of data integration. To address this issue, it becomes necessary to correct batch effects by removing technical variance when integrating cells from different batches or studies. The first method that appears for batch correction is a linear method based on linear regression such as Limma package [16] that provides the removeBatchEffect function which fits a linear model that considers the batches and their impact on gene expression. After fitting the model, it sets the coefficients associated with each batch to zero, effectively removing their impact. Another method called ComBat [17] does something similar but adds an extra step to refine the process, making the correction even more accurate by using a technique called empirical Bayes shrinkage.
However, batch effects can be highly nonlinear, making it difficult to correctly align different datasets while preserving key biological variations. In 2018, Haghverdi et al. introduced the Mutual Nearest Neighbors (MNN) algorithm to identify pairs of cells from different batches in single-cell data [18]. These identified mutual nearest neighbors aid in estimating batch effects between batches. By applying this correction, the gene expression values are adjusted to account for the estimated batch effects, aligning them more closely and reducing discrepancies introduced by the different batches. For extensive single-cell datasets with highly nonlinear batch effects, traditional methods may prove less effective, prompting researchers to explore the application of neural networks for improved batch correction.
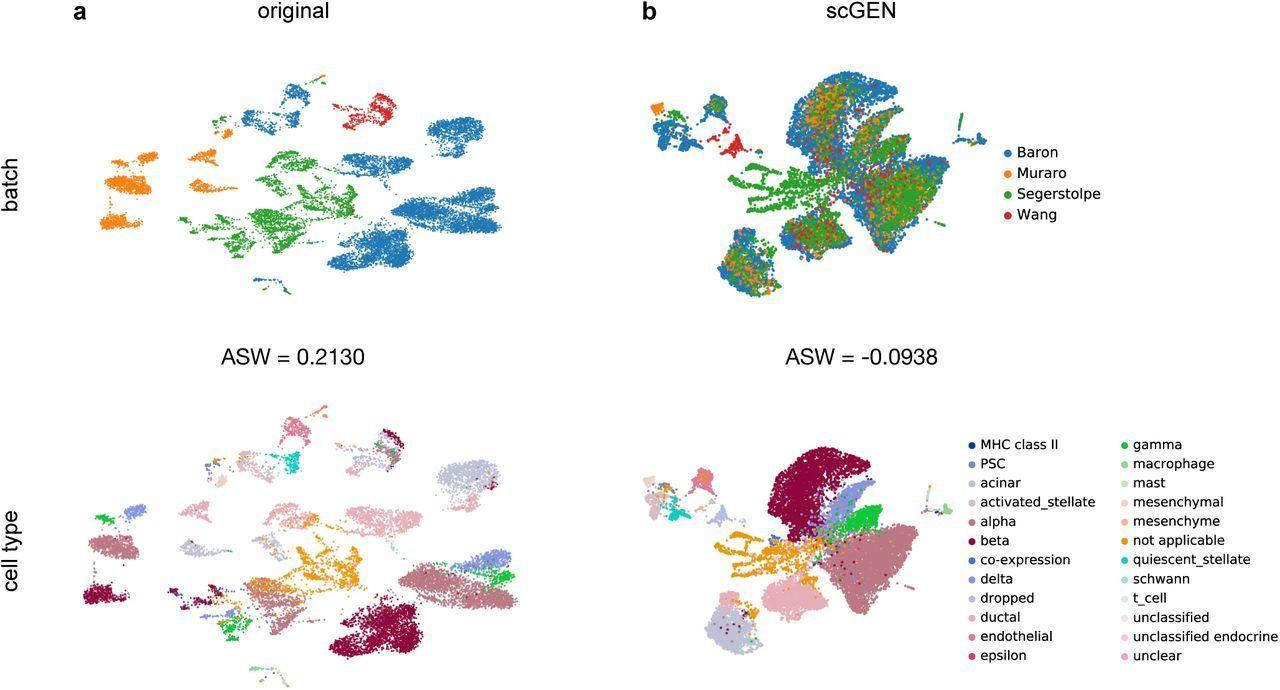
One of the pioneering models that employ deep learning for batch correction is the scGen model. Developed by Lotfollahi et al., ScGen [19] utilizes a variational autoencoder (VAE) architecture. This involves pre-training a VAE model on a reference dataset to adjust real single-cell data and alleviate batch effects. Initially, the VAE is trained to capture latent features within the reference dataset's cells. Subsequently, this trained VAE is applied to the actual data, producing latent representations for each cell. The adjustment of gene expression profiles is then based on aligning these latent representations, to reduce batch effects and harmonize profiles across different experimental conditions.
On the other hand, Zou et al. introduced DeepMNN [20], which employs a residual neural network and the mutual nearest neighbor (MNN) algorithm for scRNA-seq data batch correction. Initially, MNN pairs are identified across batches in a principal component analysis (PCA) subspace. Subsequently, a batch correction network is constructed using two stacked residual blocks to remove batch effects. The loss function of DeepMNN comprises a batch loss, computed based on the distance between cells in MNN pairs in the PCA subspace, and a weighted regularization loss, ensuring the network's output similarity to the input.
The majority of existing scRNA-seq methods are designed to remove batch effects first and then cluster cells, which potentially overlooks certain rare cell types. Recently, Xiaokang et al. developed scDML [21], a deep metric learning model to remove batch effect in scRNA-seq data, guided by the initial clusters and the nearest neighbor information intra and inter-batches. First, the graph-based clustering algorithm is used to group cells based on gene expression similarities, then the KNN algorithm is applied to identify k-nearest neighbors for each cell in the dataset, and the MNN algorithm to identify mutual nearest neighbors, focusing on reciprocal relationships between cells. To remove batch effects, deep triplet learning is employed, considering hard triplets. This helps in learning a low-dimensional embedding that accounts for the original high-dimensional gene expression and removes batch effects simultaneously.
Cell type annotation
Cell type annotation in single-cell sequencing involves the process of identifying and labeling individual cells based on their gene expression profiles, which allows researchers to capture the diversity within a heterogeneous population of cells, and understand the cellular composition of tissues, and the functional roles of different cell types in biological processes or diseases. Traditionally, researchers have used manual methods [22] to annotate cell sub-populations. This involves identifying gene markers or gene signatures that are differentially expressed in a specific cell cluster. Once gene markers are identified, researchers manually interpret the biological relevance of these markers to assign cell-type labels to the clusters. This traditional manual annotation approach is time-consuming and requires considerable human effort, especially when dealing with large-scale single-cell datasets. Due to the challenges associated with manual annotation, researchers are turning to automate and streamline the cell annotation process.
Two primary strategies are employed for cell type annotation: unsupervised-based and supervised-based. In the unsupervised realm, clustering methods such as Scanpy [23] and Seurat [10] are utilized, demanding prior knowledge of established cellular markers. The identification of clusters hinges on the unsupervised grouping of cells without external reference information. However, a drawback to this approach is a potential decrease in replicability with an increased number of clusters and multiple selections of cluster marker genes.
Conversely, supervised-based strategies rely on deep-learning models trained on labeled data. These models discern intricate patterns and relationships within gene expression data during training, enabling them to predict cell types for unlabeled data based on acquired patterns. For example, Joint Integration and Discrimination (JIND) [24] deploys a GAN-style deep architecture, where an encoder is pre-trained on classification tasks, circumventing the need for an autoencoder framework. This model also accounts for batch effects. AutoClass [25] integrates an autoencoder and a classifier, combining output reconstruction loss with a classification loss for cell annotation alongside data imputation. Additionally, TransCluster, [26] rooted in the Transformer framework and convolutional neural network (CNN), employs feature extraction from the gene expression matrix for single-cell annotation.
Despite the power of deep neural networks, obtaining a large number of accurately and unbiasedly annotated cells for training is challenging, given the labor-intensive manual inspection of marker genes in scRNAseq data. In response, semi-supervised learning has been leveraged in computational cell annotation. For instance, the SemiRNet [27] model uses both unlabeled and a limited amount of labeled scRNAseq cells to implement cell identification. SemiRNet, based on recurrent convolutional neural networks (RCNN), incorporates a shared network, a supervised network, and an unsupervised network. Furthermore, single‐cell ANnotation using Variational Inference (scANVI) [28], a semi‐supervised variant of scVI [14], maximizes the utility of existing cell state annotations. Cell BLAST, an autoencoder-based generative model, harnesses large-scale reference databases to learn nonlinear low-dimensional representations of cells, employing a sophisticated cell similarity metric—normalized projection distance—to map query cells to specific cell types and identify novel cell types.
Multi-omics Data Integration
Recent studies have demonstrated the potential of deep learning models in addressing complex and multimodal biological challenges [29]. Among the algorithms proposed thus far, it is primarily deep learning-based models that provide the essential computational adaptability necessary for effectively modeling and incorporating nearly any form of omic data including genomics (studying DNA sequences and genetic variations), epigenomics (examining changes in gene activity unrelated to DNA sequence, such as DNA modifications and chromatin structure), transcriptomics (investigating RNA molecules and gene expression through RNA sequencing), and proteomics (analyzing all proteins produced by an organism, including structures, abundances, and modifications). Deep Learning architectures, including autoencoders (AE) and generative adversarial networks (GAN), have been often used in multi-omics integration problems in single cells. The key question in multi-omics integration revolves around how to effectively represent the diverse multi-omics data within a unified latent space.
One of the early methods developed using Variational Autoencoders (VAE) for the integration of multi-omics single-cell data is known as totalVI [30]. The totalVI model, which is VAE-based, offers a solution for effectively merging scRNA-seq and protein data. In this model, totalVI takes input matrices containing scRNA-seq and protein count data. Specifically, it treats gene expression data as sampled from a negative binomial distribution, while protein data are treated as sampled from a mixture model consisting of two negative binomial distributions. The model first learns shared latent space representations through its encoder, which are then utilized to reconstruct the original data, taking into account the differences between the two original data modalities. Lastly, the decoder component estimates the parameters of the underlying distributions for both data modalities using the shared latent representation.
On the other hand, Zuo et al. [31] introduced scMVAE as a multimodal variational autoencoder designed to integrate transcriptomic and chromatin accessibility data in the same individual cells. scMVAE employs two separate single-modal encoders and two single-modal decoders to effectively model both transcriptomic and chromatin data. It achieves this by combining three distinct joint-learning strategies with a probabilistic Gaussian Mixture Model.
Recently, Lotfollahi et al. [32] introduced an unsupervised deep generative model known as MULTIGRATE for the integration of multi-omic datasets. MULTIGRATE employs a multi-modal variational autoencoder structure that shares some similarities with the scMVAE model. However, it offers added generality and the capability to integrate both paired and unpaired single-cell data. To enhance cell alignment, the loss function incorporates Maximum Mean Discrepancy (MMD), penalizing any misalignment between the point clouds associated with different assays. Incorporating transfer learning, MULTIGRATE can map new multi-omic query datasets into a reference atlas and also perform imputations for missing modalities.
Conclusion
The application of deep learning in single-cell sequencing functions as an advanced microscope, revealing intricate insights within individual cells and providing a profound understanding of cellular heterogeneity and complexity in biological systems. This cutting-edge technology empowers scientists to explore previously undiscovered aspects of cellular behavior. However, the challenge lies in choosing between traditional tools and the plethora of available deep-learning options. The landscape of tools is vast, and researchers must carefully consider factors such as data type, complexity, and the specific biological questions at hand. Navigating this decision-making process requires a thoughtful evaluation of the strengths and limitations of each tool in relation to research goals.
On the other hand, a critical need in the development of deep learning approaches for single-cell RNA sequencing (scRNA-seq) analysis is robust benchmarking. While many studies compare deep learning performance to standard methods, there is a lack of comprehensive comparisons across various deep learning models. Moreover, methods often claim superiority based on specific datasets and tissues (e.g., pancreas cells, immune cells), making it challenging to evaluate the necessity of specific terms or preprocessing steps. Addressing these challenges requires an understanding of when deep learning models fail and their limitations. Recognizing which types of deep learning approaches and model structures are beneficial in specific cases is crucial for developing new approaches and guiding the field.
In the realm of multi-omics single-cell integration, most deep learning methods aim to find a shared latent representation for all modalities. However, shared representation learning faces challenges such as heightened noise, sparsity, and the intricate task of balancing modalities. Inherent biases across institutions complicate generalization. Despite being less prevalent than single-modality approaches, integrating diverse modalities with unique cell populations is crucial. Objectives include predicting expression across modalities and identifying cells in similar states. Despite advancements, further efforts are essential for enhanced performance, particularly concerning unique or rare cell populations present in one technology but not the other.
Author Bio
Fatima Zahra El Hajji holds a master's degree in bioinformatics from the National School of Computer Science and Systems Analysis (ENSIAS), she subsequently worked as an AI intern at Piercing Star Technologies. Currently, she is a Ph.D. student at the University Mohammed VI Polytechnic (UM6P), working under the supervision of Dr. Rachid El Fatimy and Dr. Tariq Daouda. Her research focuses on the application of deep learning techniques in single-cell sequencing data.
Citation
For attribution in academic contexts or books, please cite this work as
Fatima Zahra El Hajji, "Deep learning for single-cell sequencing: a microscope to see the diversity of cells", The Gradient, 2024.
BibTeX citation:
@article{elhajji2023nar,
    author = {El Hajji, Fatima Zahra},
    title = {Deep learning for single-cell sequencing: a microscope to see the diversity of cells},
    journal = {The Gradient},
    year = {2024},
    howpublished = {\url{https://thegradient.pub/deep-learning-for-single-cell-sequencing-a-microscope-to-uncover-the-rich-diversity-of-individual-cells},
}
References
- National Human Genome Research Institute (NHGRI) : A Brief Guide to Genomics , https://www.genome.gov/about-genomics/fact-sheets/A-Brief-Guide-to-Genomics
- Method of the Year 2013. Nat Methods 11, 1 (2014). https://doi.org/10.1038/nmeth.2801
- Zappia, L., Theis, F.J. Over 1000 tools reveal trends in the single-cell RNA-seq analysis landscape. Genome Biol 22, 301 (2021). https://doi.org/10.1186/s13059-021-02519-4
- Collins FS, Fink L. The Human Genome Project. Alcohol Health Res World. 1995;19(3):190-195. PMID: 31798046; PMCID: PMC6875757.
- Tang F, Barbacioru C, Wang Y, et al. mRNA-Seq whole-transcriptome analysis of a single cell. Nat Methods. 2009; 6: 377-382.
- Eisenstein, M. The secret life of cells. Nat Methods 17, 7–10 (2020). https://doi.org/10.1038/s41592-019-0698-y
- Method of the Year 2019: Single-cell multimodal omics. Nat Methods 17, 1 (2020). https://doi.org/10.1038/s41592-019-0703-5
- Zhao, Jing et al. “Multi-view learning overview: Recent progress and new challenges.” Inf. Fusion 38 (2017): 43-54.
- Zhu, J., Shang, L. & Zhou, X. SRTsim: spatial pattern preserving simulations for spatially resolved transcriptomics. Genome Biol 24, 39 (2023).
- Butler, A., Hoffman, P., Smibert, P., Papalexi, E., & Satija, R. (2018). Integrating single-cell transcriptomic data across different conditions, technologies, and species. Nature biotechnology, 36(5), 411-420
- Wagner, F., Yan, Y., & Yanai, I. (2018). K-nearest neighbor smoothing for high-throughput single-cell RNA-Seq data. bioRxiv, 217737. Cold Spring Harbor Laboratory. https://doi.org/10.1101/217737
- Huang, M., Wang, J., Torre, E. et al. SAVER: gene expression recovery for single-cell RNA sequencing. Nat Methods 15, 539–542 (2018). https://doi.org/10.1038/s41592-018-0033-z
- Eraslan G, Simon LM, Mircea M, Mueller NS, Theis FJ. Single-cell RNA-seq denoising using a deep count autoencoder. Nat Commun. 2019 Jan 23;10(1):390. doi: 10.1038/s41467-018-07931-2. PMID: 30674886; PMCID: PMC6344535.
- Lopez, R., Regier, J., Cole, M. B., Jordan, M. I.,& Yosef, N. (2018). Deep generative modeling for single-cell transcriptomics. Nature methods, 15(12), 1053-1058.
- Y. Deng, F. Bao, Q. Dai, L.F. Wu, S.J. Altschuler Scalable analysis of cell-type composition from single-cell transcriptomics using deep recurrent learning
- Ritchie ME, Phipson B, Wu D, Hu Y, Law CW, Shi W, Smyth GK. limma powers differential expression analyses for RNA-sequencing and microarray studies. Nucleic Acids Res. 2015 Apr 20;43(7):e47. doi: 10.1093/nar/gkv007. Epub 2015 Jan 20. PMID: 25605792; PMCID: PMC4402510.
- Johnson W.E. , Li C., Rabinovic A. Adjusting batch effects in microarray expression data using empirical bayes methods. Biostatistics. 2007; 8:118–127.
- Haghverdi, L., Lun, A., Morgan, M. et al. Batch effects in single-cell RNA-sequencing data are corrected by matching mutual nearest neighbors. Nat Biotechnol 36, 421–427 (2018). https://doi.org/10.1038/nbt.4091
- Lotfollahi, M., Wolf, F. A., & Theis, F. J. (2019). scGen predicts single-cell perturbation responses. Nature methods, 16(8), 715-721.
- Zou, B., Zhang, T., Zhou, R., Jiang, X., Yang, H., Jin, X., & Bai, Y. (2021). deepMNN: deep learning-based single-cell RNA sequencing data batch correction using mutual nearest neighbors. Frontiers in Genetics, 1441.
- Yu, X., Xu, X., Zhang, J. et al. Batch alignment of single-cell transcriptomics data using deep metric learning. Nat Commun 14, 960 (2023). https://doi.org/10.1038/s41467-023-36635-5
- Z.A. Clarke, T.S. Andrews, J. Atif, D. Pouyabahar, B.T. Innes, S.A. MacParland, et al. Tutorial: guidelines for annotating single-cell transcriptomic maps using automated and manual methods Nat Protoc, 16 (2021), pp. 2749-2764
- Wolf, F., Angerer, P. & Theis, F. SCANPY: large-scale single-cell gene expression data analysis. Genome Biol 19, 15 (2018). https://doi.org/10.1186/s13059-017-1382-0
- Mohit Goyal, Guillermo Serrano, Josepmaria Argemi, Ilan Shomorony, Mikel Hernaez, Idoia Ochoa, JIND: joint integration and discrimination for automated single-cell annotation, Bioinformatics, Volume 38, Issue 9, March 2022, Pages 2488–2495, https://doi.org/10.1093/bioinformatics/btac140
- H. Li, C.R. Brouwer, W. Luo A universal deep neural network for in-depth cleaning of single-cell RNA-seq data Nat Commun, 13 (2022), p. 1901
- Song T, Dai H, Wang S, Wang G, Zhang X, Zhang Y and Jiao L (2022) TransCluster: A Cell-Type Identification Method for single-cell RNA-Seq data using deep learning based on transformer. Front. Genet. 13:1038919. doi: 10.3389/fgene.2022.1038919
- Dong X, Chowdhury S, Victor U, Li X, Qian L. Semi-Supervised Deep Learning for Cell Type Identification From Single-Cell Transcriptomic Data. IEEE/ACM Trans Comput Biol Bioinform. 2023 Mar-Apr;20(2):1492-1505. doi: 10.1109/TCBB.2022.3173587. Epub 2023 Apr 3. PMID: 35536811.
- Xu, C., Lopez, R., Mehlman, E., Regier, J., Jordan, M. I., & Yosef, N. (2021). Probabilistic harmonization and annotation of single‐cell transcriptomics data with deep generative models. Molecular Systems Biology, 17(1), e9620. https://doi.org/10.15252/msb.20209620
- Tasbiraha Athaya, Rony Chowdhury Ripan, Xiaoman Li, Haiyan Hu, Multimodal deep learning approaches for single-cell multi-omics data integration, Briefings in Bioinformatics, Volume 24, Issue 5, September 2023, bbad313, https://doi.org/10.1093/bib/bbad313
- Gayoso, A., Lopez, R., Steier, Z., Regier, J., Streets, A., & Yosef, N. (2019). A Joint Model of RNA Expression and Surface Protein Abundance in Single Cells. bioRxiv, 791947. https://www.biorxiv.org/content/early/2019/10/07/791947.abstract
- Chunman Zuo, Luonan Chen. Deep-joint-learning analysis model of single cell transcriptome and open chromatin accessibility data. Briefings in Bioinformatics. 2020.
- Lotfollahi, M., Litinetskaya, A., & Theis, F. J. (2022). Multigrate: single-cell multi-omic data integration.bioRxiv.https://www.biorxiv.org/content/early/2022/03/17/2022.03.16.484643

