
The Roman physician Galen was among the first people to realize that the brain controlled motor responses, cognitive function, and memory. (Freemon 1994) But how does the brain control these processes? Ever since Galen, this question has propelled the field of neuroscience.
Beginning with Paul Broca’s work in the 1800s, brain function has been described in terms of modular separation: each region in the brain controls a unique set of behaviors, actions, and capacities. (Anon n.d.). This determination was made through observation of patients suffering neurological symptoms and connecting them to localized brain injuries. For example, Broca’s area (a brain region in the inferior frontal gyrus) was found to be responsible for speech fluency (Acharya and Wroten 2022), and was discovered by studying two subjects, both of whom exhibited reduced speech capacity and suffered from lesions in the same area of the brain. (Acharya and Wroten 2022). While Broca’s documentation was crucial in establishing the connection between speech and a specific brain region, this neuroanatomic link between structure and function fails to capture the complexity of the relationships between brain and behavior. (Flinker et al. 2015)

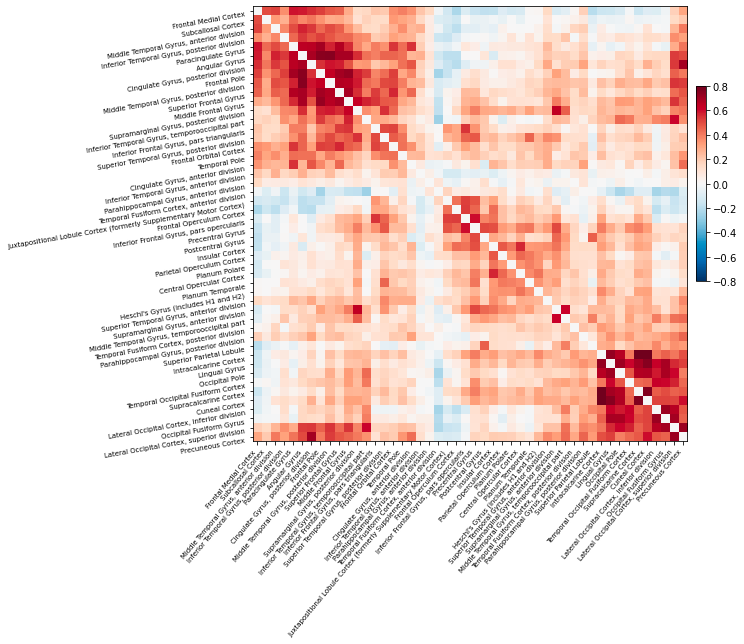
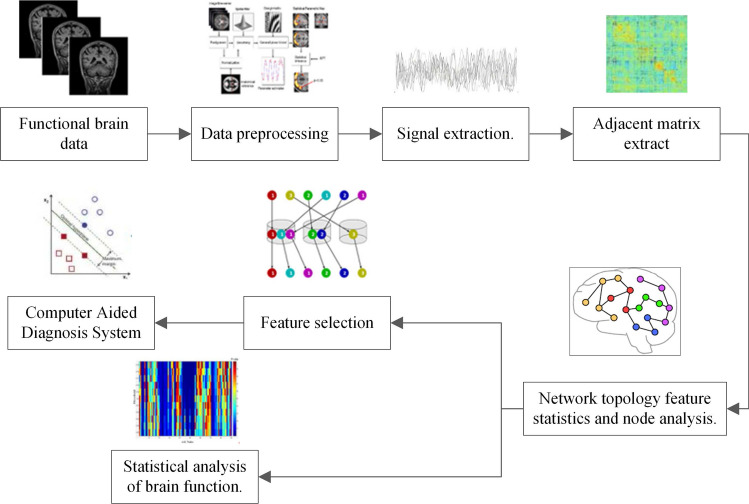
Thanks to modern neuroimaging technologies such as functional magnetic resonance imaging (fMRI), we can now see in real time not only how individual brain regions respond to stimuli, but also how spatially distant regions interact in response to stimuli. In other words, fMRI can visualize functional rather than merely anatomic neural connections. (Friston 1994) To do so, fMRI measures the temporal correlation of the blood oxygen level-dependent (BOLD) signal between brain regions. (Biswal et al. 1995).Activation can be positively correlated, meaning when one region activates during a task or during rest, so too does another. (van den Heuvel and Hulshoff Pol 2010) Activation can also be anti-correlated, meaning that when one region activates, another region’s neural activity decreases. (Chai et al. 2012) Functional connectivity presages the idea of the brain as a network - regions are considered components of the same network if their activation is consistently correlated. (Eickhoff and Müller 2015)
Examining simple correlations between regional activity is only the start of how functional connectivity can be explored. During the last decade, more advanced techniques borrowed from graph theory have been applied to brain imaging research (Rubinov and Sporns 2010). The growing field of complex network analysis takes a multidisciplinary approach to characterizing brain networks with a small number of neurobiologically meaningful measures (Rubinov and Sporns 2010). Importantly, graph-based analyses can model the dynamics of the entire brain network all at once, thereby enabling investigation of network-wide properties. (Brier et al. 2014) Network analysis may be sensitive even to subtle changes in brain function, because they can be used to characterize whole network changes with relatively simple measures. (Brier et al. 2014) This article will elucidate what these metrics are, how they have been applied, and demonstrate their use and limitations, specifically in the realm of Alzheimer’s Disease (AD).
All networks can be described through two primary components, nodes and edges, and the relationships between nodes and edges. (Stanley et al. 2013) In the context of brain networks, nodes are a predefined region of interest, and edges measure connectivity between nodes. (Stanley et al. 2013) After calculating the network, a series of standard measures can be used to understand both global and local properties of the interactions between brain areas. (Stanley et al. 2013) This allows researchers to explore networks across the entire brain. (Bullmore and Sporns 2009) Broadly, these measures can be characterized as measures of functional integration, functional segregation, centrality, and small-worldness. (Bullmore and Sporns 2009)
Measures of functional integration:
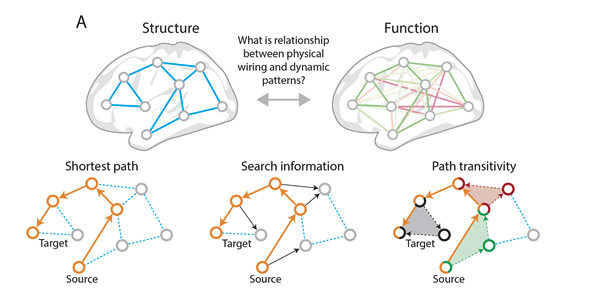
Functional integration refers to the brain’s ability to combine information from different brain regions. (Rubinov and Sporns 2010) Measures of integration estimate how easy it is for different brain regions to communicate. The first step in determining functional integration is to estimate path length. Path lengths in functional networks are sequences of associations that represent potential routes of information flow. After deducing the path lengths between components of the brain network, the characteristic path length (the average shortest path length between all pairs of nodes) can be established. (Rubinov and Sporns 2010) The characteristic path length provides information about how easily information can be transferred across the network. The next metric of functional integration is global efficiency, which is the average inverse shortest path length. Global efficiency provides similar information as path length but is less influenced by regions that are more isolated from the network. (Rubinov and Sporns 2010)
Measures of segregation:
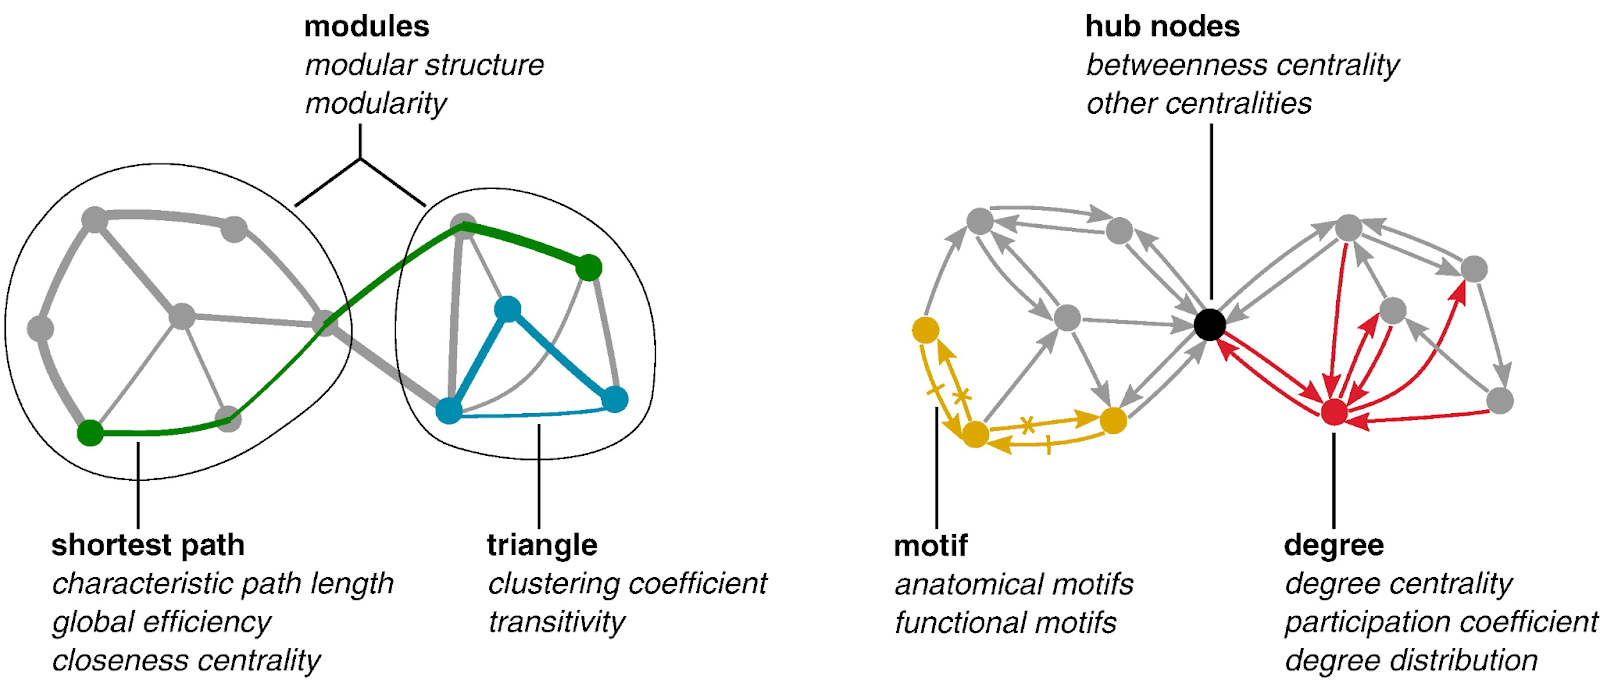
Functional segregation refers to the brain’s ability to conduct specialized information processing within highly interconnected groups of brain regions. (Rubinov and Sporns 2010) Measures of segregation quantify the presence of such interconnected groups, also known as clusters. In functional networks, the presence of such clusters indicates segregated neural processing. (Rubinov and Sporns 2010) These measures are based on the number of triangles found in the brain network. To determine functional segregation, first the clustering coefficient must be determined – the proportion of triangles around an individual region. Next, modularity can be established – the degree to which the network can be divided into non-overlapping groups. Each module will correspond with a specialized functional area (i.e., the visual region). (Rubinov and Sporns 2010)
Measures of centrality:
Centrality refers to how important a given brain region is to facilitating information processing and controlling information flow within the network. (Rubinov and Sporns 2010) Measures of centrality assess how integrated a particular region is with other regions in the network. (Rubinov and Sporns 2010) A key measure of centrality is degree, which refers to the number of links connected to a specific region. Regions with a high degree interact with many other regions in that network. Degrees can be used to classify regions into functional groups. (Rubinov and Sporns 2010)
Small-world measures:
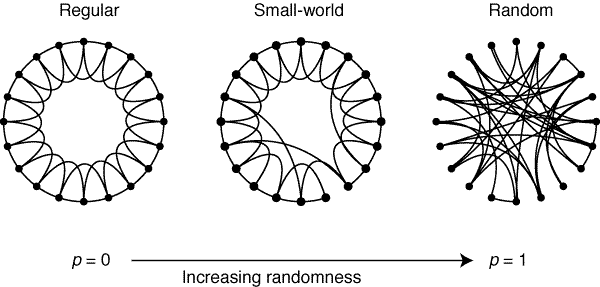
Small-world networks often characterize biological systems, including the brain. (Rubinov and Sporns 2010) A formal definition of a small-world network is one that is more clustered than a random network, but similar path length to a random network. (Rubinov and Sporns 2010) In biology, the property of small-worldness represents a balance of functional integration and segregation. Both structural and functional brain networks are known to have small-world topologies. (Rubinov and Sporns 2010) Small-worldness of functional networks can be calculated as the ratio of the clustering coefficients to the path length. (Rubinov and Sporns 2010)
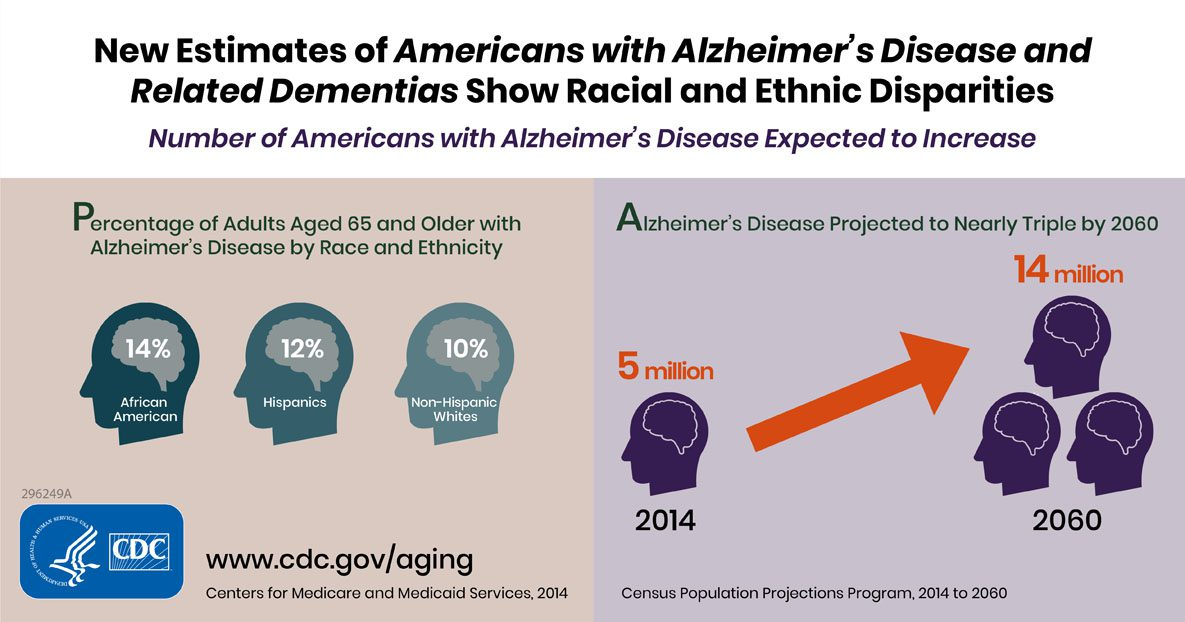
To illustrate how these measures can be used to better understand and classify disease, we will use AD as an example. AD is the most prevalent form of dementia, and is clinically defined by cognitive and behavioral decline, usually beginning with memory loss. (Zhang et al. 2021) The most common explanation of AD pathology is that abnormal aggregations in the brain of two proteins, amyloid and tau, are responsible for AD’s devastating neurodegeneration. (Busche and Hyman 2020) Globally, AD prevalence and deaths due to AD are both higher in women than in men. (Zhang et al. 2021) As of 2020, AD was the sixth leading overall cause of death in America, and deaths due to AD have increased 146% between 2000 to 2018. (Alzheimer’s Association 2020) By 2050, it is estimated that the number of Americans aged 65 and older living with AD will reach 13.8 million, up from 5.8 million in 2020. (Alzheimer’s Association 2020) In 2020 alone, the cost of care for people aged 65 and older with AD and other dementias is estimated at $305 billion. (Alzheimer’s Association 2020)
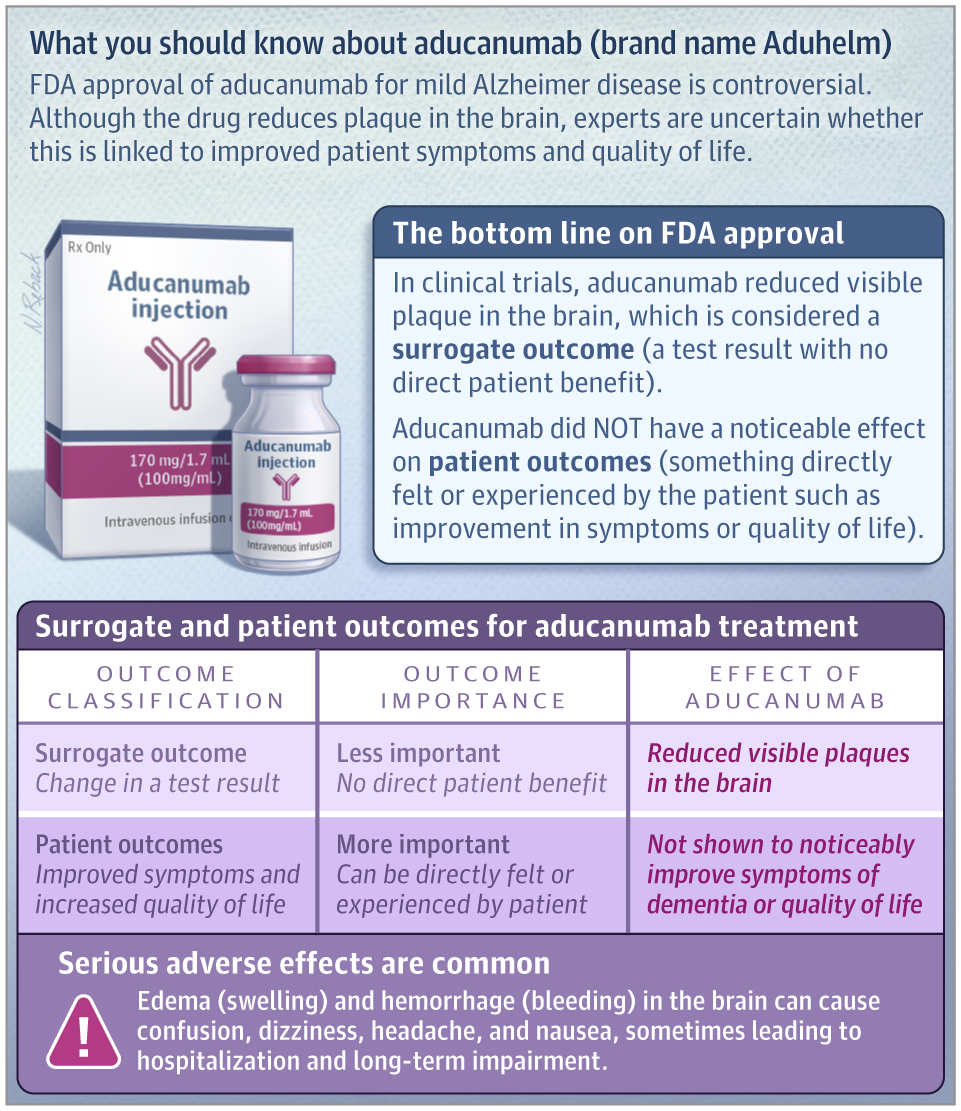
Currently, treatments for AD may slow symptom progression, but there is no cure. (Woloshin and Kesselheim 2022) Even a recently approved AD medication was only shown to reduce visible amyloid in the brain, and did not have a noticeable effect on cognitive function. (Woloshin and Kesselheim 2022) In other words, even when targeting one of the proteins causally implicated in AD pathology, no improvements were seen on the health outcomes that matter most. Some have gone so far as to suggest that overreliance on the amyloid/tau hypothesis has actually stymied progress towards finding a cure for AD by diverting attention from other biological mechanisms that may spur AD degeneration. (Spires-Jones 2021) If true, other models to understand AD pathology are desperately needed. Recently, there has been growing interest in determining ‘neuromarkers’ for AD - in other words, neural connectivity patterns that are AD-specific. (Song et al. 2019) Network analysis may provide insight and perspective on different approaches to identify those with AD and ultimately develop successful interventions.
One of the first connections between network analysis and a deeper understanding of AD is the model of AD as a ‘disconnection syndrome.’ (Delbeuck et al. 2003) This concept was first introduced to refer to pathologies where a distinct event (such as a stroke) caused brain regions to dissociate from each other (GESCHWIND 1965). The disconnection hypothesis suggests that cognitive dysfunction occurs due to disconnection processes between different brain regions. (Delbeuck et al. 2003) At first the hypothesis was driven by evidence from neuroanatomic disconnections, it has been extended to include functional disconnections based on recognition that functional disconnection can be independent from anatomic impairment and vice versa. (Delbeuck et al. 2003; Han et al. 2012)
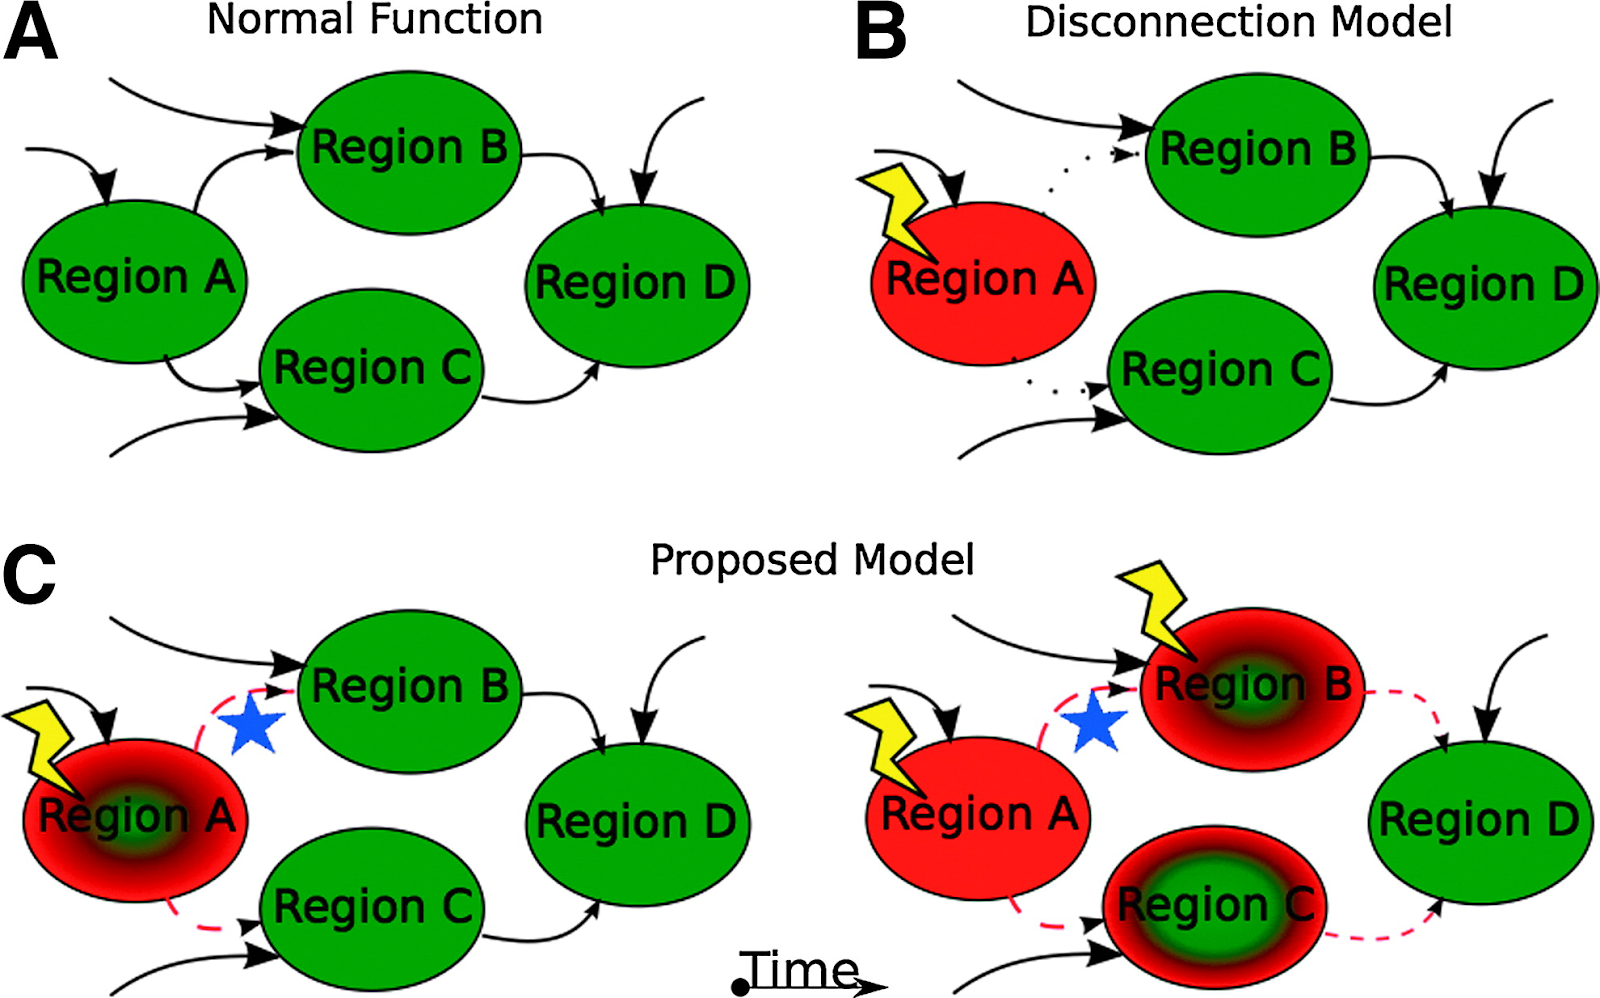
In AD, decreased connectivity within the default mode network in particular has bolstered the hypothesis that AD is a disconnection syndrome. (van den Heuvel and Hulshoff Pol 2010) The default mode network includes high level cortical areas and is known as the ‘task negative’ network, wherein regions that show strongly correlated activity at rest deactivate during goal-oriented tasks. (Ma and Zhang 2021; Raichle et al. 2001) In essence, when functioning properly, the default mode network will be most active at rest and least active during cognitively demanding activities. However, in AD, it has been shown that the default mode network experiences reduced deactivation relative to healthy controls during visual encoding and working memory tasks. (Rombouts et al. 2005) The default mode network is not the only network that becomes disconnected as AD progresses. Executive control and sensorimotor networks also appear to disconnect, even at the mild to moderate stage of AD. (Brier et al. 2012) These network disruptions are unexpected insofar as they do not necessarily map on to the severity of AD histopathology (deposition of amyloid and tau proteins in the relevant brain regions), as would be expected according to the amyloid/tau hypothesis. (Brier et al. 2014) However, the original studies that found network changes in AD considered changes in the correlation structure but did not investigate those changes in the context of whole-brain networks. (Brier et al. 2014) Using common strategies such as evaluating many individual pairwise correlations or averaging over sets of pairwise correlations obscure the dynamics of the network as a whole. (Brier et al. 2014) Graph theory measures allow researchers to avoid those potential issues.
What do graph theoretical measures tell us about AD as a disconnection syndrome? What distinguishes networks disconnected due to AD from networks in those who maintain healthy cognitive function or only have mild cognitive impairments? First, in a genetic variant of AD, changes in graph-based metrics were over a decade before disease onset. (Vermunt et al. 2020) Specifically, path length decreased in the precuneus region 13 years prior to symptom onset, and globally 12 years prior to symptom onset. Interestingly, the precuneus region itself is a hub of connection to other brain regions and belongs to the default mode network. (Pereira 2020) In these patients, local cluster connections (and thereby small world topology) was also lost. This indicates that in those who develop AD, brain networks become progressively more random, losing the balance between global and local connectivity. (Pereira 2020) These results provide some evidence that network changes in the brain predict future AD development. Furthermore, changes in clustering coefficients parallelled disease progression. (delEtoile and Adeli 2017) Building upon that work, it was found that minor edges (aka nonhub edges) were deleted, changing paths in the brain such that intra-regional connections were decreased. (Suckling et al. 2015) Loss of small world properties have also been replicated, additionally indicating disrupted local connectivity. (Supekar et al. 2008) Overall, results to date suggest that local connectivity decreases (likely driving clinical presentation), while global connectivity remains relatively stable. (Engels et al. 2015; delEtoile and Adeli 2017) Recent work has begun to use graph theory methods to distinguish between AD, cognitive impairment, and normal cognition.
Classification accuracy of AD versus mild cognitive impairment or normal cognitive function has been reported between 77% to 100% depending on patient population and methodology. (T. Zhang et al. 2021; Khazaee et al. 2015; X. Zhang et al. 2021) The current standards for AD diagnostics are based on clinical assessment and amyloid/tau neuropathology. However, the sensitivity of these diagnostics ranges from 70-87% and the specificity ranges from 44-70%. (Beach et al. 2012) As neuroimaging has been widely used to support dementia diagnoses for over a decade, it may not be unduly burdensome to incorporate graph theory measures into AD classification given that patients are likely already undergoing neuroimaging. (Ferreira and Busatto 2011)
Limitations of the literature on graph theory and AD include small sample sizes, which may limit generalizability to larger and more diverse populations. Additionally, studies may use different methods of functional connectivity, from linear to complex nonlinear methods. (Hlinka et al. 2011) Brain parcellations schema also differ between studies, as does preprocessing of the raw data for movement, spatial smoothing, and nuisance signal regression. (Power et al. 2012) Yet as the field develops, including more frequent use of large cohorts with standardized preprocessing pipelines and publicly available data (such as the Human Connectome Project), results may become more reproducible and representative. (Anon n.d.)
In conclusion, graph theory measures may provide powerful means of understanding brain function at both the global and regional levels. These measures may be particularly useful when it comes to understanding network changes in the brain that occur due to disease. Using AD as a case study, graph theory derived measures have been successfully used to predict AD, analyze its neuropathology, and classify AD with a high degree of accuracy. While there are limitations to the clinical applicability and generalization of these methods, network analysis in neuroimaging research is a growing field and much remains to be discovered.
Citation
For attribution in academic contexts or books, please cite this work as
Rebecca Ehrenkranz, "Overview of Graph Theory and Alzheimer's Disease", The Gradient, 2022.
BibTeX citation:
@article{ehrenkranz_graph_ad,
author = {Ehrenkranz, Rebecca},
title = {Overview of Graph Theory and Alzheimer's Disease},
journal = {The Gradient},
year = {2022},
howpublished = {\url{https://thegradient.pub/overview-of-graph-theory-and-alzheimers-disease} },
}
